

Before you begin
- Labs create a Google Cloud project and resources for a fixed time
- Labs have a time limit and no pause feature. If you end the lab, you'll have to restart from the beginning.
- On the top left of your screen, click Start lab to begin
Create a new connection and data source
/ 100
Looker Studio is a free, modern business intelligence product that lets you create dynamic, visually compelling reports and dashboards. With Looker Studio, you can:
Looker Studio automatically saves every change you make, so there's no need to click Save when editing a report.
In this lab you will create a report by pulling in a public dataset from BigQuery. You will then add a chart and style to your report, which will make your data elegant and easy to understand.
Read these instructions. Labs are timed and you cannot pause them. The timer, which starts when you click Start Lab, shows how long Google Cloud resources are made available to you.
This hands-on lab lets you do the lab activities in a real cloud environment, not in a simulation or demo environment. It does so by giving you new, temporary credentials you use to sign in and access Google Cloud for the duration of the lab.
To complete this lab, you need:
Click the Start Lab button. If you need to pay for the lab, a dialog opens for you to select your payment method. On the left is the Lab Details pane with the following:
Click Open Google Cloud console (or right-click and select Open Link in Incognito Window if you are running the Chrome browser).
The lab spins up resources, and then opens another tab that shows the Sign in page.
Tip: Arrange the tabs in separate windows, side-by-side.
If necessary, copy the Username below and paste it into the Sign in dialog.
You can also find the Username in the Lab Details pane.
Click Next.
Copy the Password below and paste it into the Welcome dialog.
You can also find the Password in the Lab Details pane.
Click Next.
Click through the subsequent pages:
After a few moments, the Google Cloud console opens in this tab.

You should be automatically logged in with your lab's username, but if not, log out and sign in with the lab credentials you were given.
You are already on the reports home page.
Click the Plus Button to create a new report.
In the Account Setup screen, enter Country and Company name.
Accept the Looker Studio Terms of Service and click Continue.
Select No for receiving Tips and recommendations, Product announcements and Market research.
Click Continue.
Now click on the Blank Report plus button again.
Click X to close the Add data to report window.
Now you are in the Report Editor, which gives you the controls and tools needed to add charts, data, and style to your report.
You are now ready to add data to your report.
There is a list of Google connectors, which are the "pipes" that allow a Looker Studio data source to access the information stored in your data sets.
From the toolbar, select Add data.
From the list of Google Connectors, select the BigQuery tile.
Then click on the Authorize button to let Looker Studio view your data in BigQuery.
From the left menu, click Public Datasets > Your Project ID > san_francisco > bikeshare_trips.
Then click Add in the bottom right corner.
You will then be prompted with "You are about to add a data source to this report", click Add to report.
You have successfully connected Looker Studio to a public dataset hosted in BigQuery. Now you are ready to build a chart from the San Francisco bikeshare trip dataset.
Click Check my progress to verify your performed task. If you have successfully created a new connection and data source with BigQuery, you will see an assessment score.
Build a time series graph from your dataset.
From the toolbar, select Add a chart.
Then click Time series chart from the dropdown menu.
Adjust the positioning of the chart by selecting and dragging it; or by selecting the chart and using your keyboard arrow keys to move it. Drag the corner of the chart to expand it.
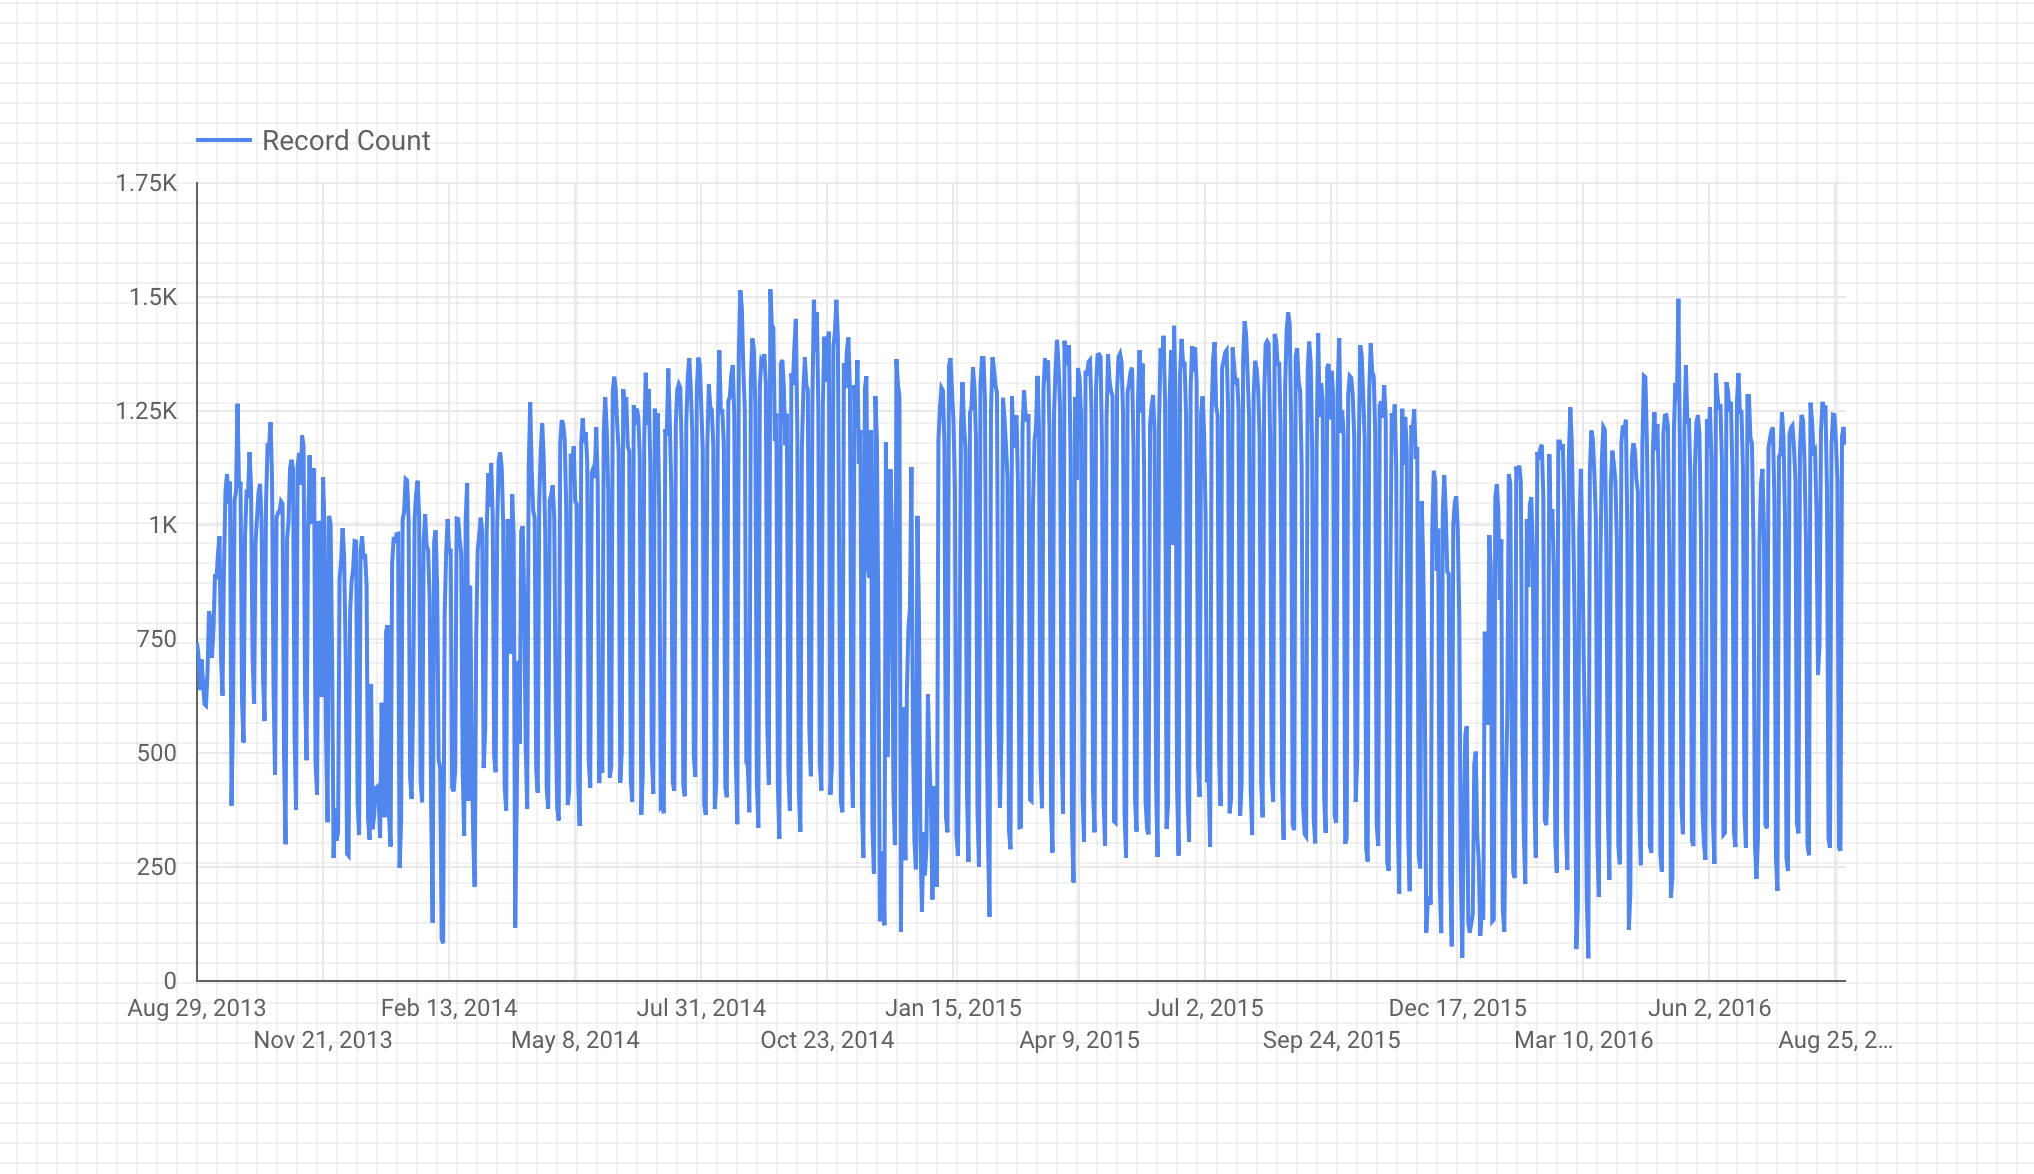
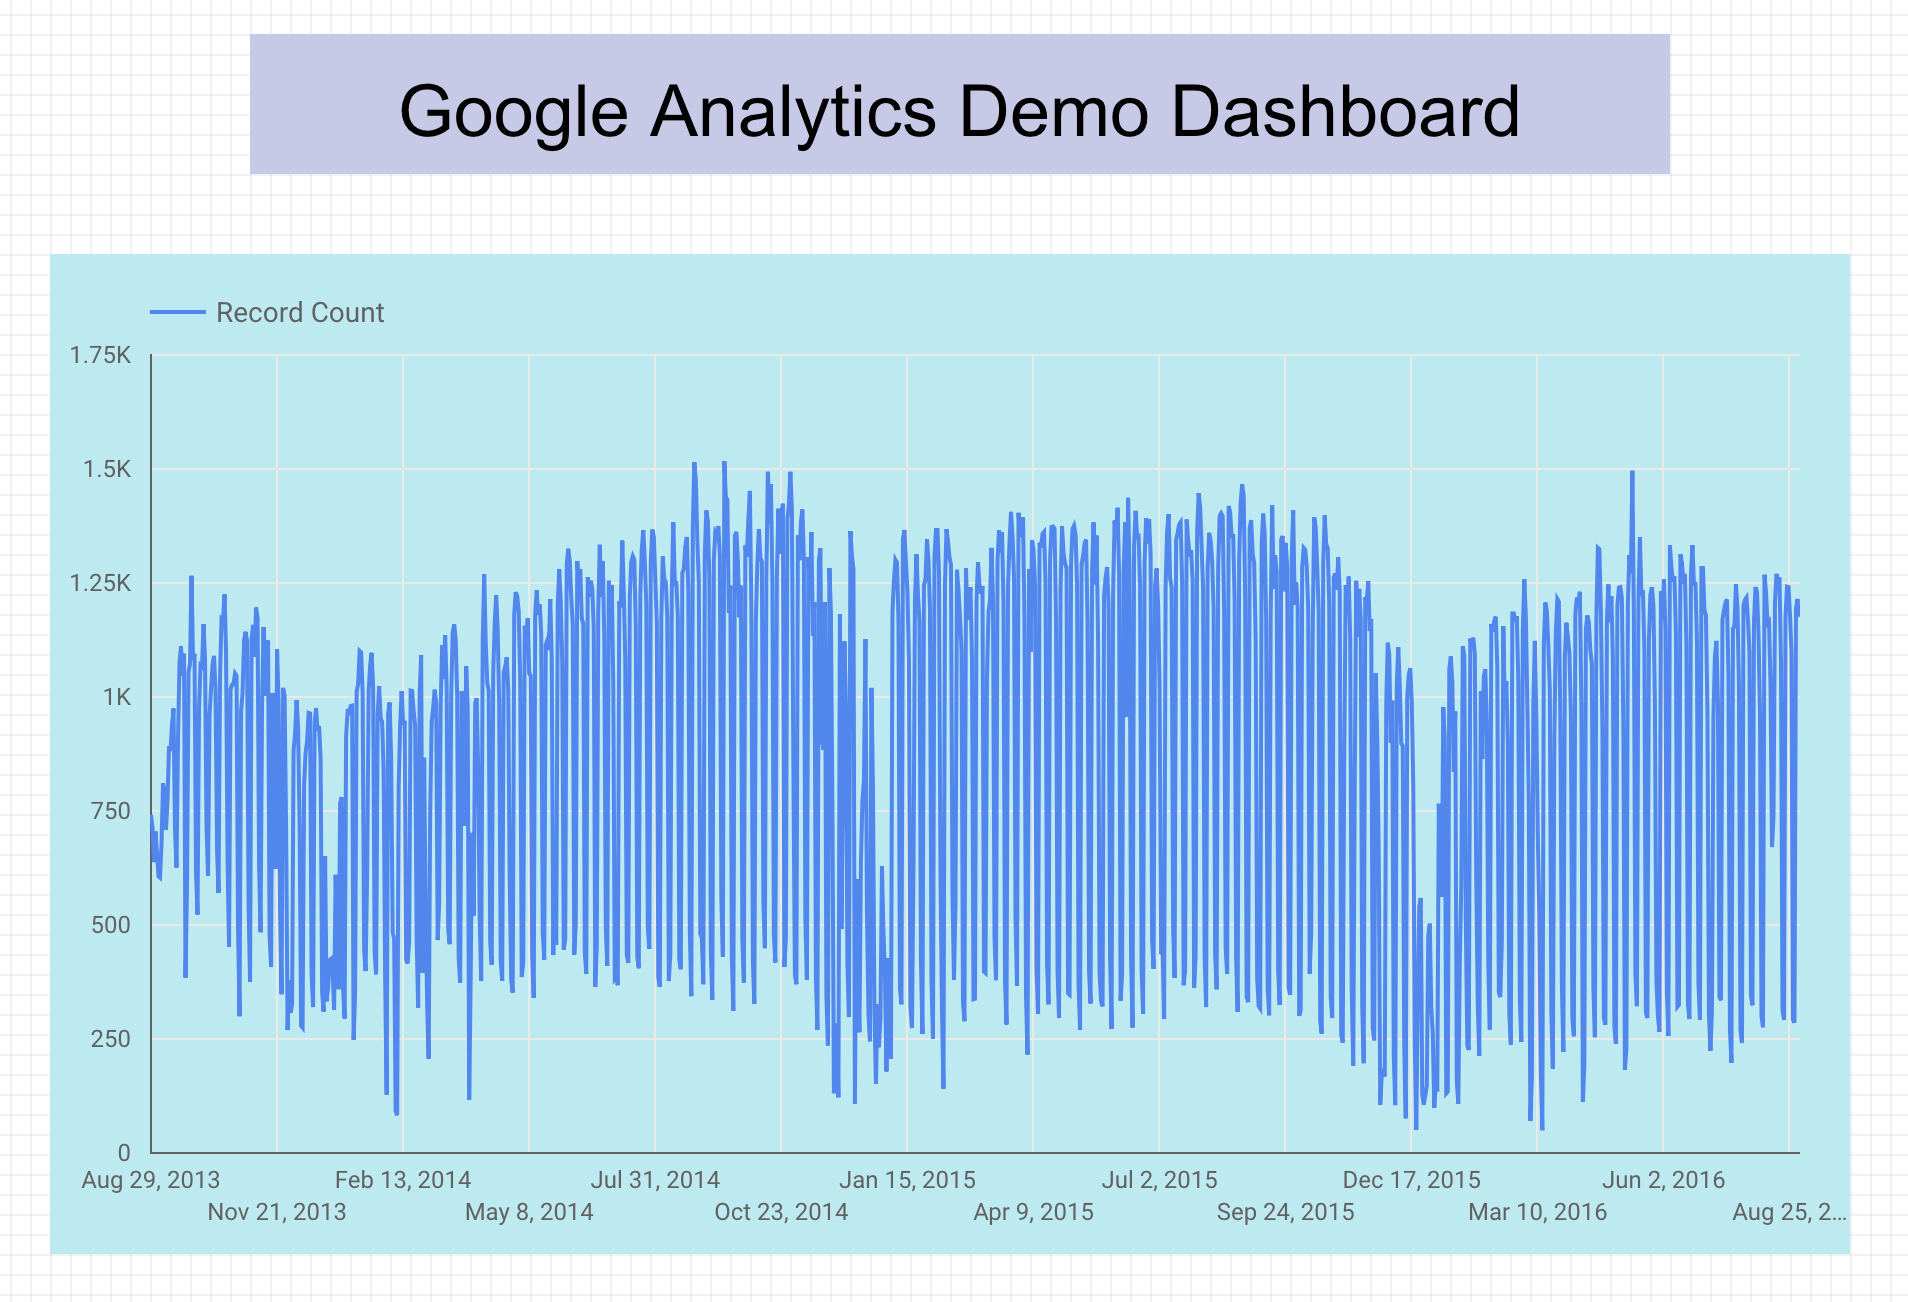
Your chart should resemble the following:
The time series chart shows the number of bikeshares used in San Francisco over time (it doesn't look like this transportation method is too popular in the winter time.)
In Looker Studio, click anywhere on the graph paper, but not on the chart you just made.
Click Theme and layout from the toolbar and stay on the Theme tab.
Click Customize.
Scroll down to the Component background and border section and click on the paint bucket.
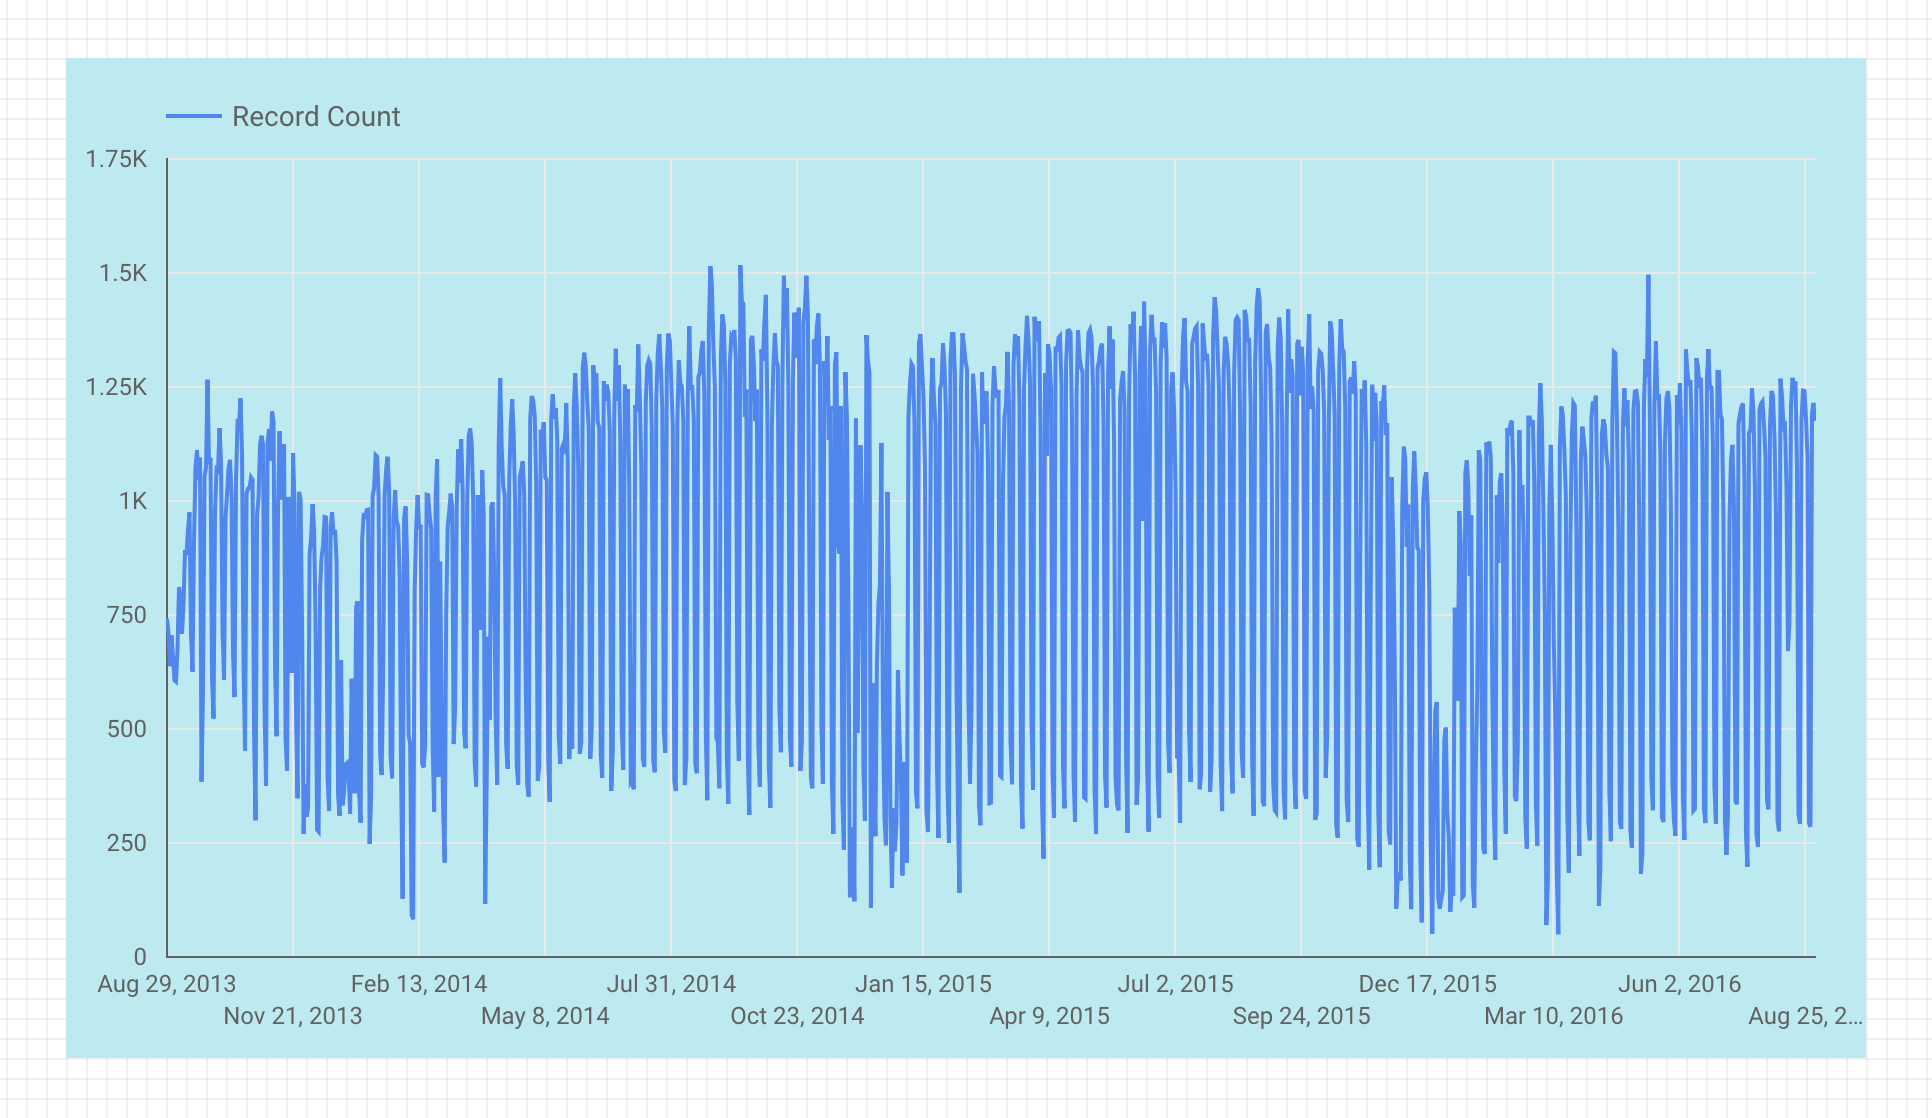
Choose a background color for your chart from the color pallet. Here's one example:
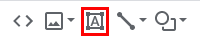
Select the Shape icon > Rectangle tool from the top toolbar.
Draw a rectangle across the top of the page.
Click inside the newly created banner. This will open the Rectangle Properties panel.
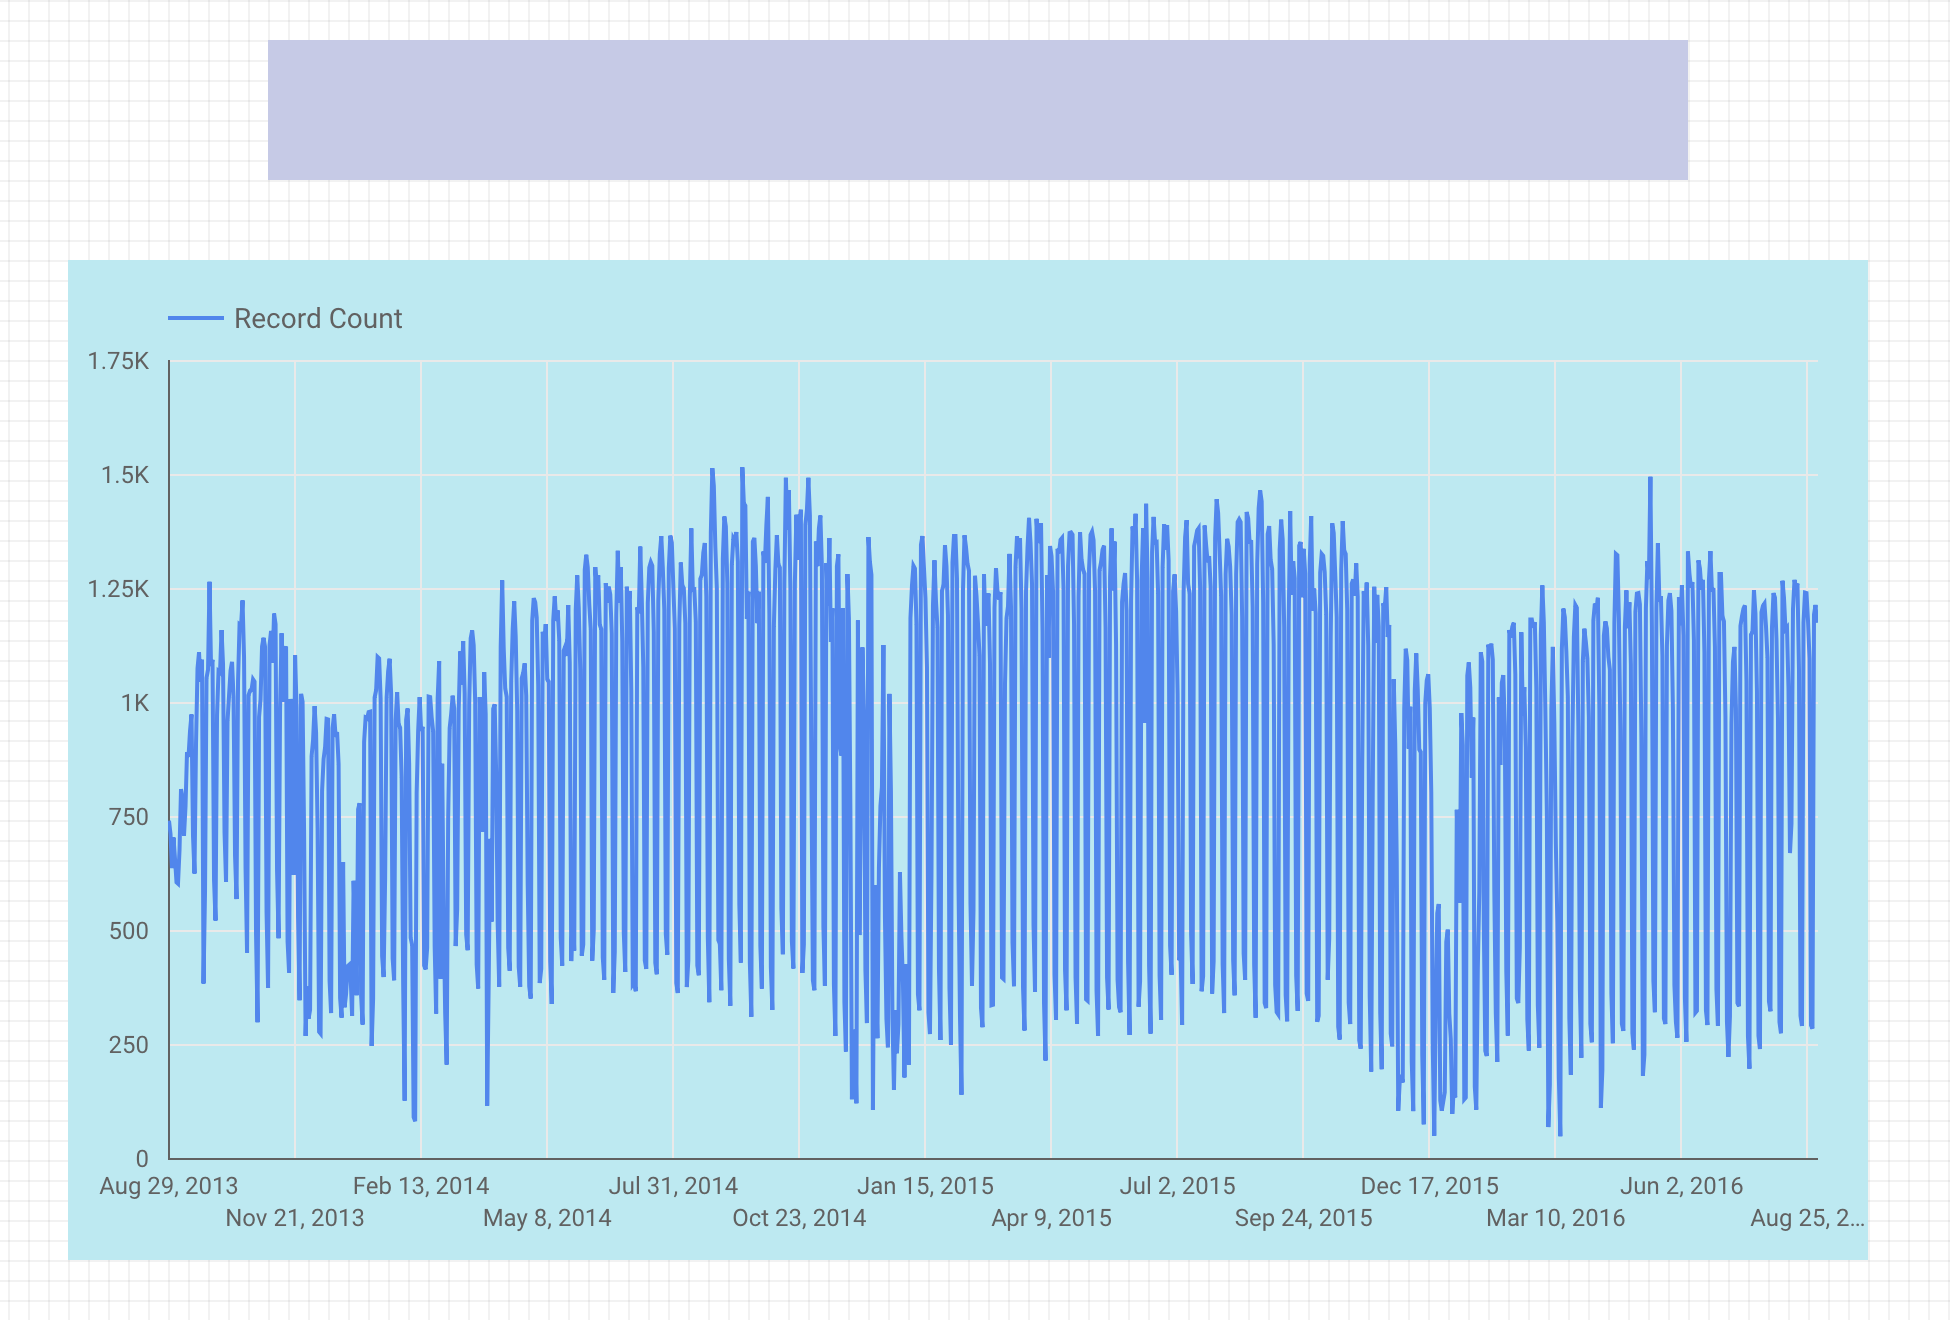
Choose a background color for your banner. Your graph will now resemble the following:
Make sure the background of the text is transparent.
Type "Google Analytics Demo Dashboard" in the textbox.
Resize your textbox to fit the rectangle, and change the font color and size to something that looks nice to you.
Nice looking report!
This lab is part of a series of labs called Qwik Starts. These labs are designed to give you a little taste of the many features available with Google Cloud. Search for "Qwik Starts" in the lab catalog to find the next lab you'd like to take!
Learn how to prepare your data to work best with Looker Studio:
...helps you make the most of Google Cloud technologies. Our classes include technical skills and best practices to help you get up to speed quickly and continue your learning journey. We offer fundamental to advanced level training, with on-demand, live, and virtual options to suit your busy schedule. Certifications help you validate and prove your skill and expertise in Google Cloud technologies.
Manual Last Updated June 27, 2023
Lab Last Tested June 27, 2023
Copyright 2025 Google LLC All rights reserved. Google and the Google logo are trademarks of Google LLC. All other company and product names may be trademarks of the respective companies with which they are associated.


Ta treść jest obecnie niedostępna
Kiedy dostępność się zmieni, wyślemy Ci e-maila z powiadomieniem

Świetnie
Kiedy dostępność się zmieni, skontaktujemy się z Tobą e-mailem

One lab at a time
Confirm to end all existing labs and start this one