

Before you begin
- Labs create a Google Cloud project and resources for a fixed time
- Labs have a time limit and no pause feature. If you end the lab, you'll have to restart from the beginning.
- On the top left of your screen, click Start lab to begin
Creating a Cloud Function
/ 50
Create logs-based metric
/ 50
In this lab you use Cloud Monitoring to view Cloud Run functions details in the Google Cloud console. The Cloud Run function details include execution times and counts, and memory usage.
In this lab, you learn how to perform the following tasks:
Read these instructions. Labs are timed and you cannot pause them. The timer, which starts when you click Start Lab, shows how long Google Cloud resources are made available to you.
This hands-on lab lets you do the lab activities in a real cloud environment, not in a simulation or demo environment. It does so by giving you new, temporary credentials you use to sign in and access Google Cloud for the duration of the lab.
To complete this lab, you need:
Click the Start Lab button. If you need to pay for the lab, a dialog opens for you to select your payment method. On the left is the Lab Details pane with the following:
Click Open Google Cloud console (or right-click and select Open Link in Incognito Window if you are running the Chrome browser).
The lab spins up resources, and then opens another tab that shows the Sign in page.
Tip: Arrange the tabs in separate windows, side-by-side.
If necessary, copy the Username below and paste it into the Sign in dialog.
You can also find the Username in the Lab Details pane.
Click Next.
Copy the Password below and paste it into the Welcome dialog.
You can also find the Password in the Lab Details pane.
Click Next.
Click through the subsequent pages:
After a few moments, the Google Cloud console opens in this tab.

Cloud Shell is a virtual machine that is loaded with development tools. It offers a persistent 5GB home directory and runs on the Google Cloud. Cloud Shell provides command-line access to your Google Cloud resources.
Click Activate Cloud Shell 
Click through the following windows:
When you are connected, you are already authenticated, and the project is set to your Project_ID,
gcloud is the command-line tool for Google Cloud. It comes pre-installed on Cloud Shell and supports tab-completion.
Output:
Output:
gcloud, in Google Cloud, refer to the gcloud CLI overview guide.
Before you collect logs and alerts, you need something to monitor. In this section, you create a Hello World Cloud Run function to monitor.
In the Cloud console, select Navigation menu (
Set the following:
helloworld
Expand Container(s), Volumes, Networking, Security and set the following:
Execution environment: select second generation.
Revision scaling, set the Maximum number of instances to 5.
Leave the rest of the fields as default. Click Create.
The function automatically deploys and is listed on the Cloud Run function page. This takes a few minutes. When you see a green check mark next to the name, the Cloud Run function is complete.
Test completed task
Click Check my progress to verify your performed task. If you have completed the task successfully you will be granted an assessment score.
Open a new Cloud Shell window by clicking the Activate Cloud Shell
In Cloud Shell, run the following to get a tool called vegeta that will let you send some test traffic to your Cloud Run function:
If you see Hello World! in the new browser tab that opens, you're up and running!
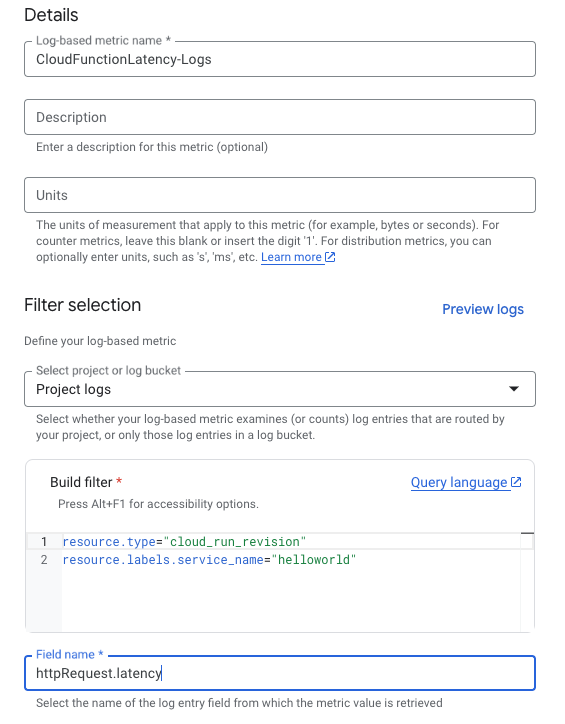
Now you'll create a Distribution type logs based metric to extract the value of latency from the log entries httpRequest.latency field.
In the console, select Navigation menu > View All Products > Observability > Logging > Logs Explorer. The Cloud Logging opens in the console.
To look at just the logs from your Cloud Run function, in the All resources dropdown, select Cloud Run Revision > helloWorld then click Apply.
Click Run query.
In Actions dropdown click Create metric.
In the Create log-based metric form:
httpRequest.latency for Field name.The log-based metric should look like this:
Now you'll see your user-defined metric added to your Logs-based Metrics page.
Test completed task
Click Check my progress to verify your performed task. If you have completed the task successfully you will be granted an assessment score.
Next, you'll use Metrics Explorer to look at the data for your Cloud Run function.
Set up a Monitoring Metrics Scope that's tied to your Google Cloud Project. The following steps create a new account that has a free trial of Monitoring.
) > View All Products > Observability > Monitoring.When the Monitoring Overview page opens, your metrics scope project is ready.
In the left menu, click Metrics explorer.
Click on Select a metric dropdown. Deselect the Active button.
Type CloudRunFunctionLatency-Logs in filter by resource or metric name and then select Cloud Run Revision > Logs-based metric > Logging/user/CloudRunFunctionLatency-Logs from the suggested metrics and click Apply.
Active. Logs-based metrics may initially show as 'Not Active' in the Metrics Explorer. This means that the metric has not yet received enough data to be considered active. It may take several minutes (or more) and sufficient traffic generation for the metric to become active.
If you encounter issues:
vegeta tool (increase the duration or rate).On the top right corner change the widget type to Stacked bar chart using the dropdown menu.
Explore other graph options and try a different metric. For example, click your current Cloud Run Revision metric to open the dropdown, select Cloud Run Revision > Request Count, and change the widget type to Stacked area chart.
Continue to explore and experiment. For example, go back to the Cloud Run Revision metric and change the Aggregation to the 95th percentile. Select the widget type Line chart.
Creating charts on the Monitoring Overview window is a great way to track metrics that are important to you. In this section, you set up the same charts you created in the previous section, but now they'll be saved into the Monitoring Overview window.
In the left menu, click Dashboards.
Click Create Custom Dashboard.
Click on Add widget.
Under Visualization, select Stacked bar.
Under Select a metric dropdown select the default Cloud Run Revision > Request Count metric to open the dropdown and change the metric. Click Apply on the top right.
Click Add widget. Under Visualization, select Heatmap.
Start typing Cloud Run Revision into the Select a metric dropdown, and then select Cloud Run Revision > Logs-based metric > Logging/user/CloudRunFunctionLatency-Logs from the suggested metrics and click Apply.
Active.
Click Add widget. Under Visualization, select Line.
Start typing Cloud Run Revision into the Select a metric dropdown, and then select Cloud Run Revision > Request_latency from the suggested metrics. Set the Aggregation to Mean and click Apply.
Click Add widget. Under Visualization, select Stacked bar.
Start typing Cloud Run Revision into the Select a metric dropdown, and then select Cloud Run Revision > Container > Container CPU Allocation from the suggested metrics. Click Apply.
By default, the charts name themselves after the metric you're using, but you can rename them.
New Dashboard - and rename it to Cloud Run Function Custom Dashboard.For a quick reference, to see these charts click Dashboards in the left panel of the Monitoring page.
Below are multiple-choice questions to reinforce your understanding of this lab's concepts. Answer them to the best of your abilities.
Congratulations! In this lab, you created a Cloud Run function, created a logs-based metric, used Metrics Explorer, and created charts on the Monitoring Overview window.
...helps you make the most of Google Cloud technologies. Our classes include technical skills and best practices to help you get up to speed quickly and continue your learning journey. We offer fundamental to advanced level training, with on-demand, live, and virtual options to suit your busy schedule. Certifications help you validate and prove your skill and expertise in Google Cloud technologies.
Manual Last Updated March 5, 2025
Lab Last Tested March 5, 2025
Copyright 2025 Google LLC All rights reserved. Google and the Google logo are trademarks of Google LLC. All other company and product names may be trademarks of the respective companies with which they are associated.


Questi contenuti non sono al momento disponibili
Ti invieremo una notifica via email quando sarà disponibile

Bene.
Ti contatteremo via email non appena sarà disponibile

One lab at a time
Confirm to end all existing labs and start this one