
![The compute overview search results with '[Metricbeat GCP] Compute Overview' selected](https://cdn.qwiklabs.com/c24d5EsScYmne2iM7eNibFkH3hJ0zJmvc5nbq1m2fEw%3D)
![The [Filebeat GCP] Audit dashboard](https://cdn.qwiklabs.com/AknN40I2K%2FvnWuwkmnDd5MBR2ciH1vW27JFxpEvvySk%3D)

Before you begin
- Labs create a Google Cloud project and resources for a fixed time
- Labs have a time limit and no pause feature. If you end the lab, you'll have to restart from the beginning.
- On the top left of your screen, click Start lab to begin
Set up a Service Account
/ 40
Create sink
/ 30
Configure Filebeat Google Cloud module
/ 30
This lab was developed with our partner, Elastic. Your personal information may be shared with Elastic, the lab sponsor, if you have opted in to receive product updates, announcements, and offers in your Account Profile.
In this lab, you will learn how to use the Elastic Stack to monitor Google Cloud. You will start by creating a simple Elasticsearch deployment using Elastic Cloud.
The goal of this lab will be to install and deploy Elasticsearch then use Beats, which are Elastic's lightweight data shippers, which sends operational data - logs and metrics - from systems and applications. You will use Beats to collect and monitor your services on Google Cloud.
In this lab, you learn how to perform the following tasks:
This is an introductory level lab. No prior knowledge of Elastic and its various products and features are required, though basic system configuration, such as knowing how to run commands via a Linux based command line, and editing text files using a Unix based text editor (like Vim or Nano) is advantageous.
There is a Vim Tips section in this lab in case you need a little help or refresher to get the standard text editing accomplished.
Read these instructions. Labs are timed and you cannot pause them. The timer, which starts when you click Start Lab, shows how long Google Cloud resources are made available to you.
This hands-on lab lets you do the lab activities in a real cloud environment, not in a simulation or demo environment. It does so by giving you new, temporary credentials you use to sign in and access Google Cloud for the duration of the lab.
To complete this lab, you need:
Click the Start Lab button. If you need to pay for the lab, a dialog opens for you to select your payment method. On the left is the Lab Details pane with the following:
Click Open Google Cloud console (or right-click and select Open Link in Incognito Window if you are running the Chrome browser).
The lab spins up resources, and then opens another tab that shows the Sign in page.
Tip: Arrange the tabs in separate windows, side-by-side.
If necessary, copy the Username below and paste it into the Sign in dialog.
You can also find the Username in the Lab Details pane.
Click Next.
Copy the Password below and paste it into the Welcome dialog.
You can also find the Password in the Lab Details pane.
Click Next.
Click through the subsequent pages:
After a few moments, the Google Cloud console opens in this tab.

Cloud Shell is a virtual machine that is loaded with development tools. It offers a persistent 5GB home directory and runs on the Google Cloud. Cloud Shell provides command-line access to your Google Cloud resources.
Click Activate Cloud Shell 
Click through the following windows:
When you are connected, you are already authenticated, and the project is set to your Project_ID,
gcloud is the command-line tool for Google Cloud. It comes pre-installed on Cloud Shell and supports tab-completion.
Output:
Output:
gcloud, in Google Cloud, refer to the gcloud CLI overview guide.
:(colon sign), the line number, then the Enter key.x to remove letters or symbols, unless in insert mode, where you will use the keyboard's normal delete/backspace keys.i to enter into insert mode where you will then be able to add/remove text.Esc key to exit out of insert mode, where you will then write/save the file by entering everything everything below, including the colon sign:This is to say, you enter a : then wq which writes the file and quits the vim editor as soon as pressing the enter key.
Elasticsearch is a real-time, distributed storage, search, and analytics engine. It can be used for many purposes, but one context where it excels is indexing streams of semi-structured data, such as logs or decoded network packets.
In this section, you will first need to sign up for an Elastic free trial with your personal email address. You will then log into Elastic Cloud and create a deployment.
You should be redirected to Elastic Cloud.
On the Create deployment page, give your deployment a name (i.e my-lab-demo) and choose the closest Google Cloud region to you.
Click Create Deployment.
Download or copy and save the password for the Elastic user, as you will use this later in the lab.
Once your deployment is ready, click Continue.
On the Welcome Page, click Explore on my own.
Google Cloud implements service accounts as a way to access APIs securely. To monitor Google Cloud with Elastic, you will need a service account. The easiest way is to use a predefined service account that Google Cloud creates automatically. Alternatively, you can create a new service account. In this lab, you will create a new one.
First, navigate to the Google Cloud Console. To access the service account menu, click Navigation Menu > IAM & Admin > Service Accounts.
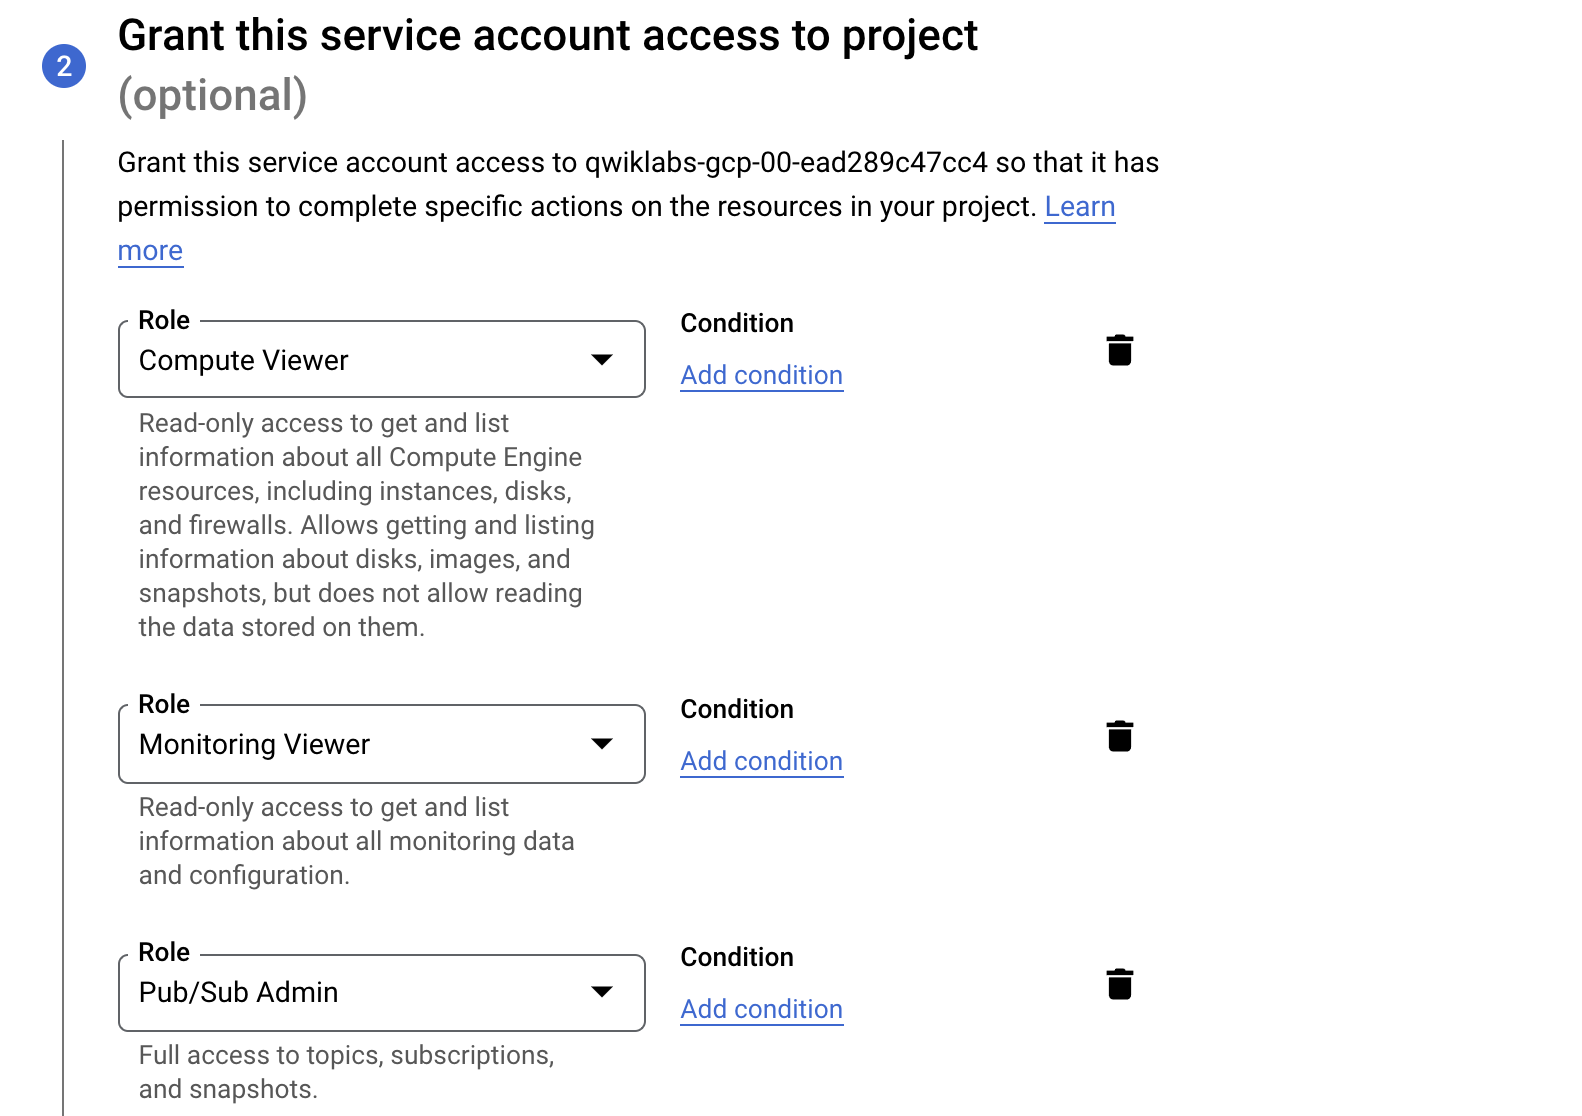
Next, click Create Service Account. For the new service account name, use gcp-monitor. Optionally add a description (for example, "Service account to monitor Google Cloud services using the Elastic Stack"). Click Create and Continue.
Next, add three main roles to the service account to monitor Google Cloud services:
Click Continue, then skip granting users access to this service.
Finally, click Done. The service account is now ready to be used.
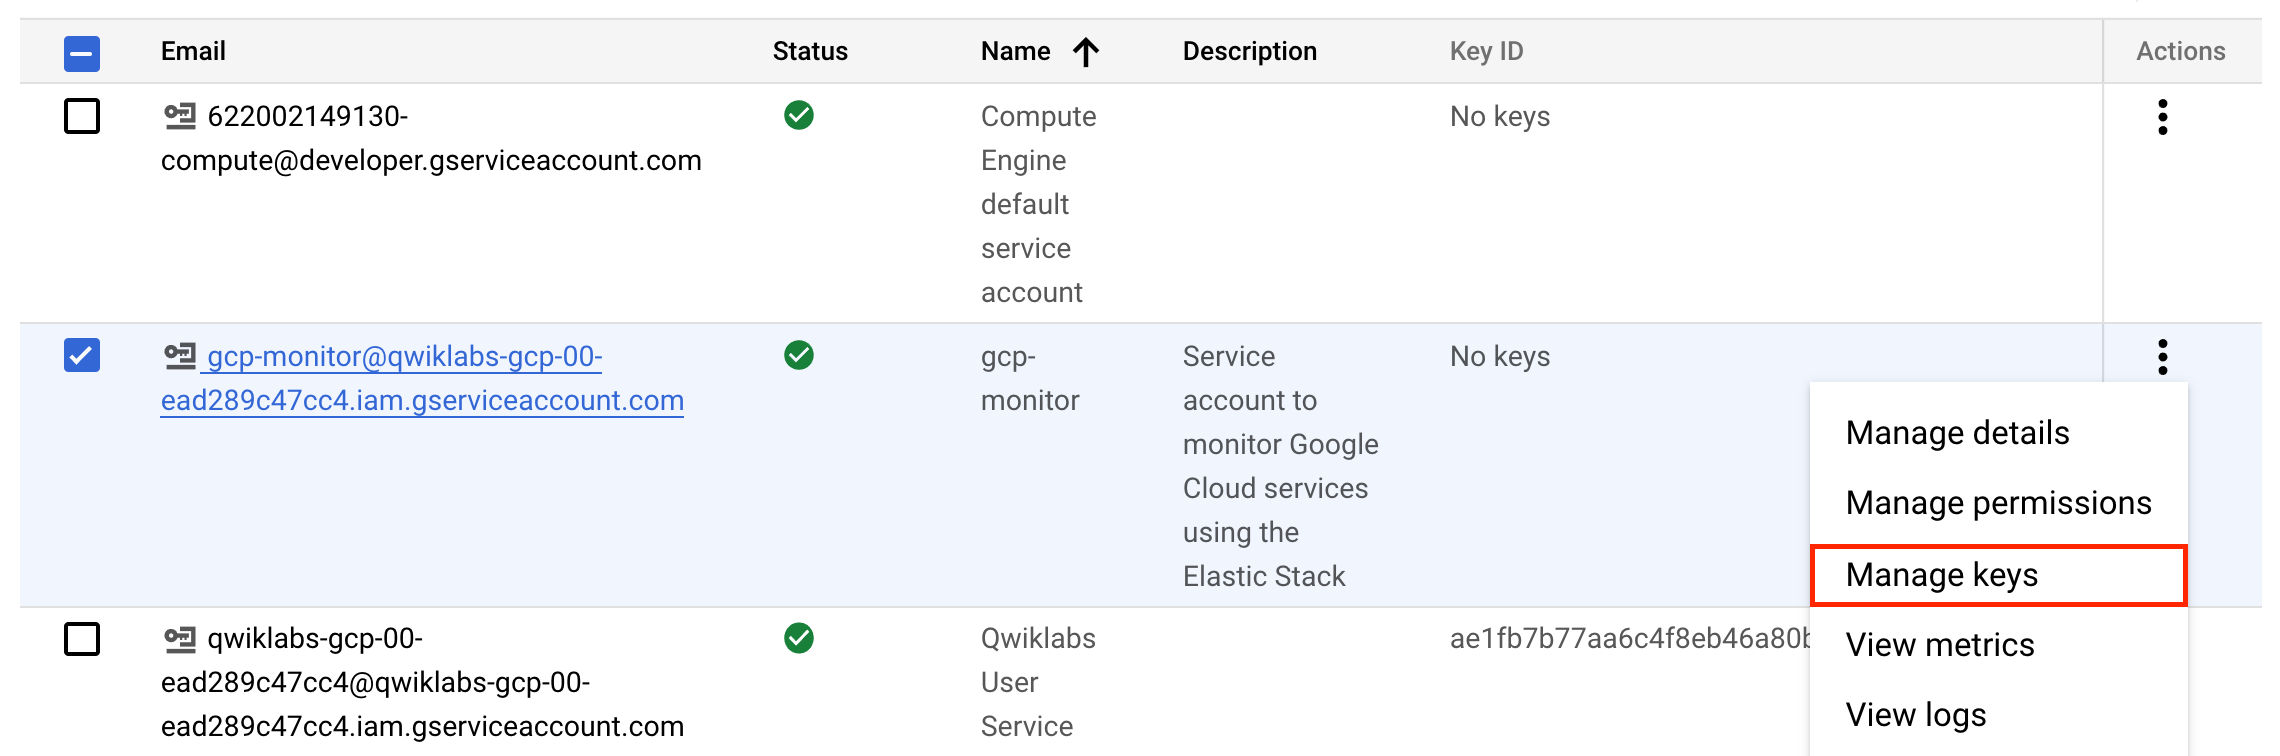
Next, to use the service account just created gcp-monitor, click Manage keys.
On the Keys page, click Add Key > Create new key.
Select JSON as the type and click Create.
After clicking Create, the credential file is downloaded. Rename the file as credentials.json. Keep this file in an accessible place to use later.
Click Close.
Click Check my progress to verify the objective.
To monitor Google Cloud using the Elastic Stack, you need two main components: an Elastic deployment to store and analyze the data and an agent to collect and ship the data.
Two agents can be used to monitor Google Cloud:
You can run the agents on any machine. For this lab, you will be using Cloud Shell.
Navigate to Cloud Shell.
Download and install Metricbeat:
username:password in this command. To find your Cloud ID, click on your deployment.
Next, you are going to configure Metricbeat output to Elasticsearch Service.
To store metrics in Elasticsearch with minimal permissions, create an API key to send data from Metricbeat to Elasticsearch Service.
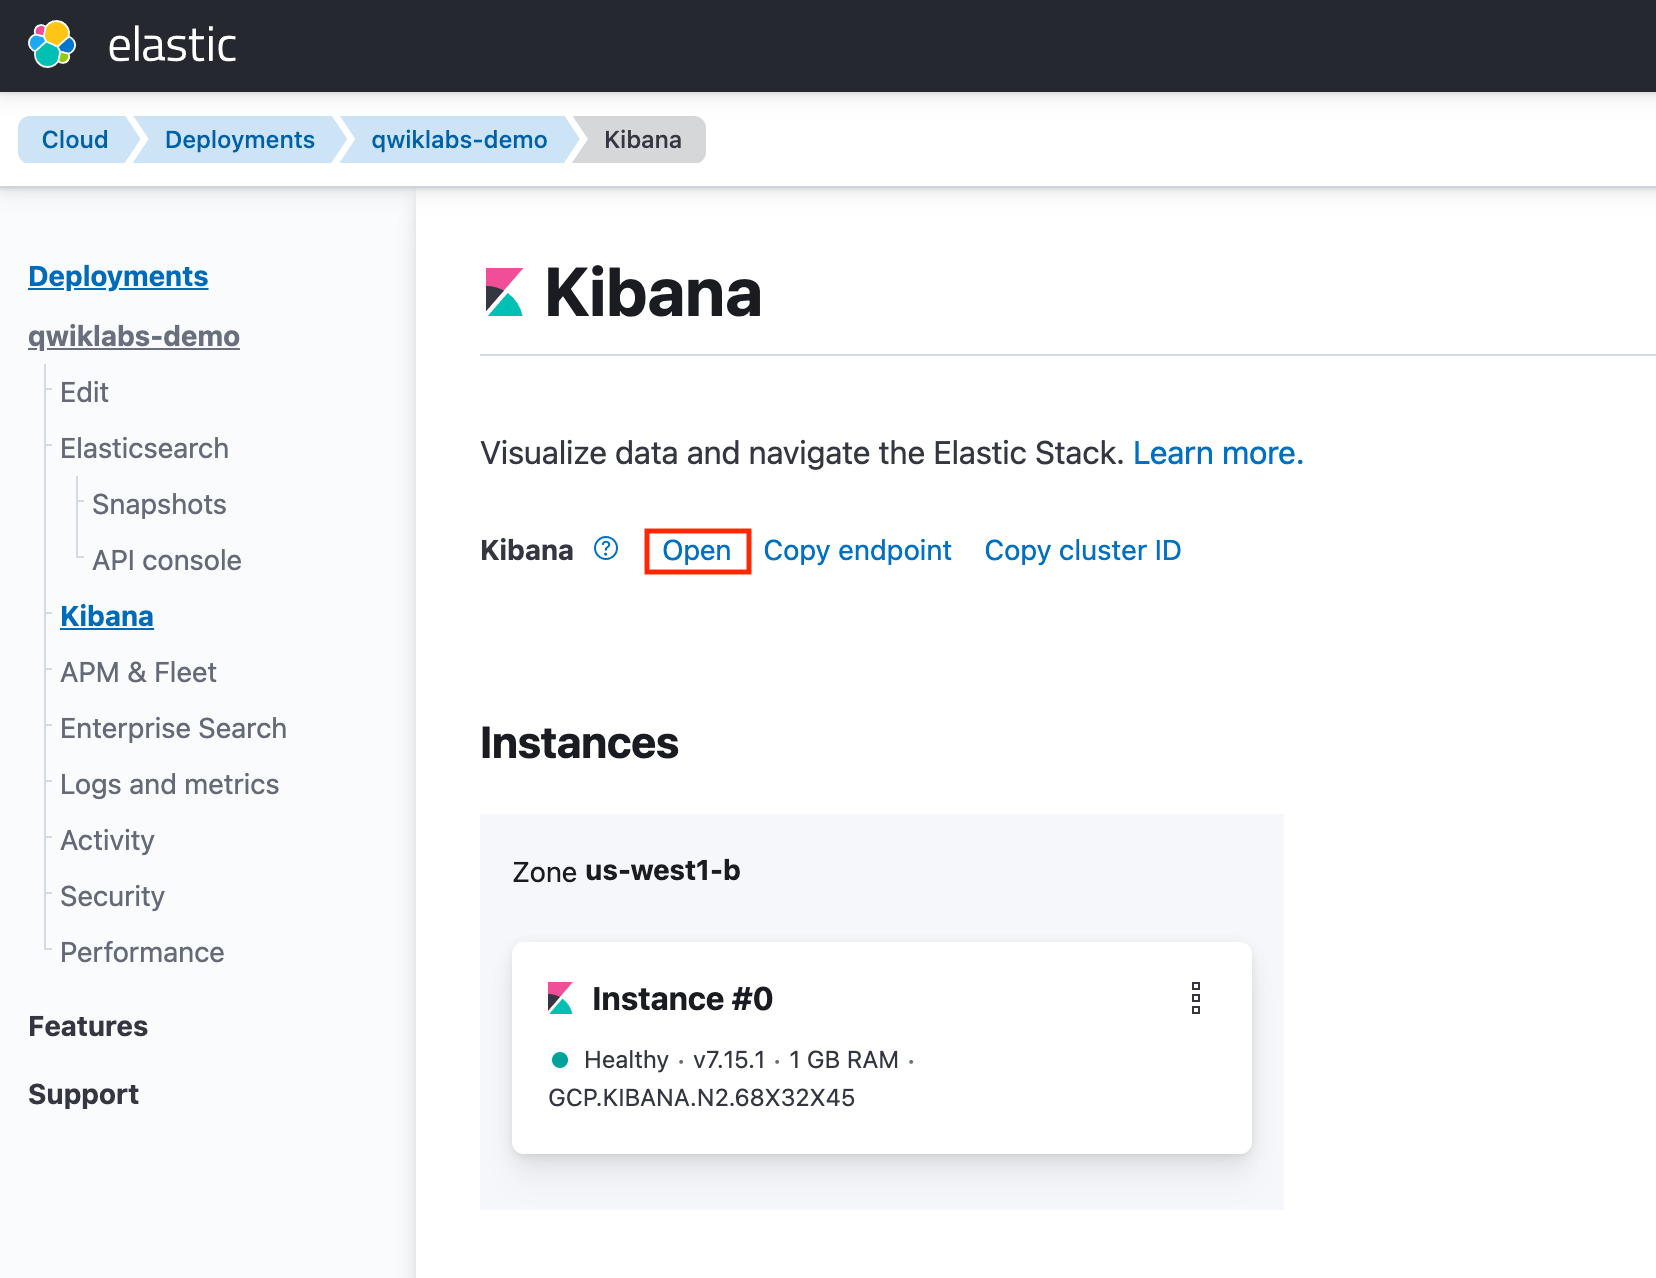
Click Open.
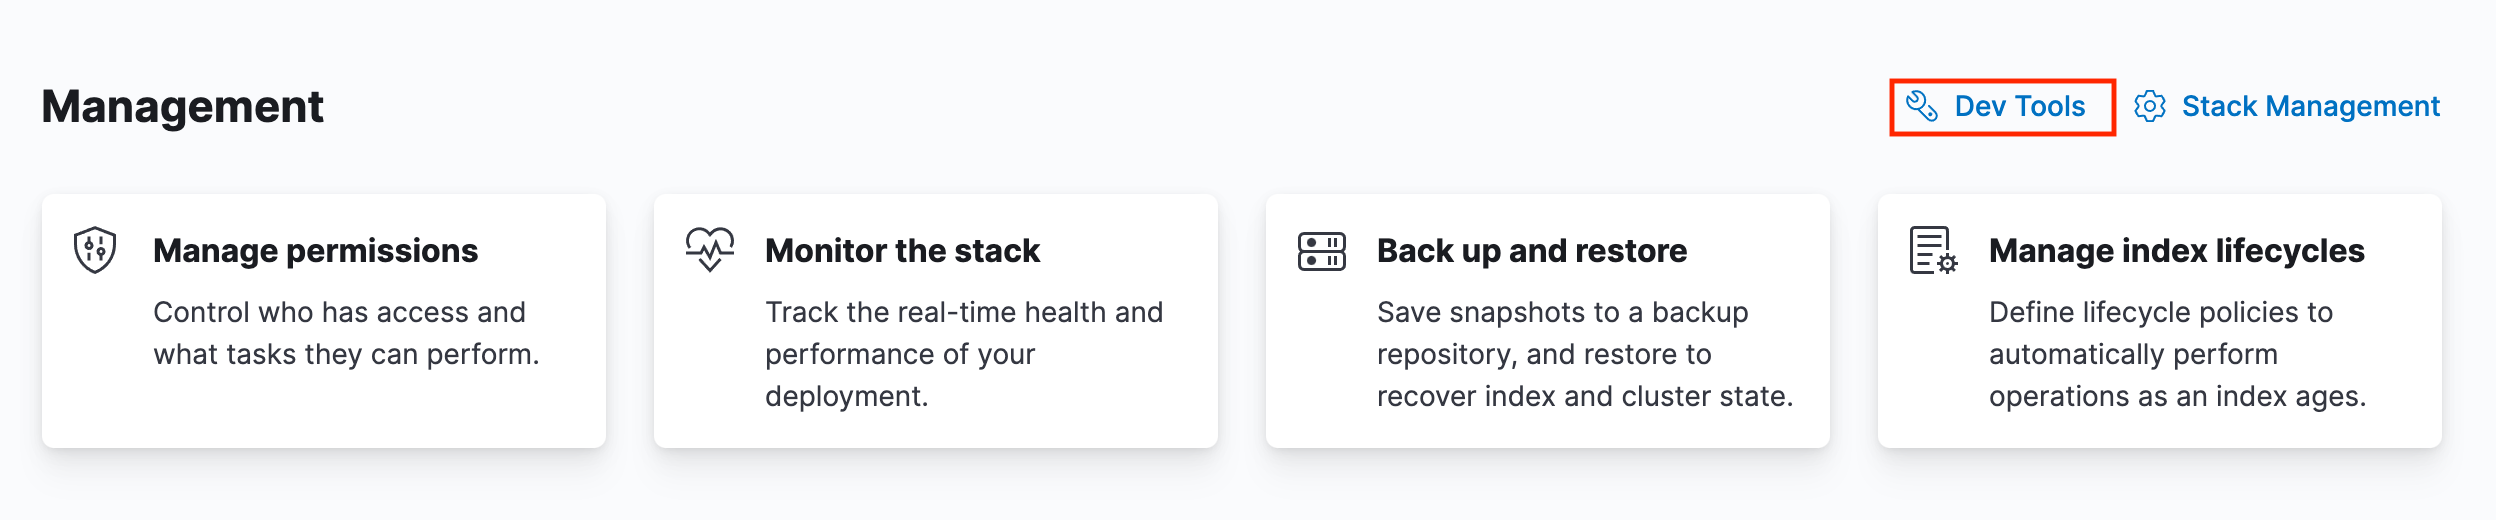
Select Management > Dev Tools.
api_key and an id field, which can be stored in the Metricbeat keystore in the following format: id:api_key:-n parameter; otherwise, you will have painful debugging sessions due to adding a newline at the end of your API key
metricbeat.yml configuration file. Add the following lines to the end of the file:Now that the output is working, you are going to set up the input (Google Cloud).
To collect metrics from Google Cloud use the Google Cloud Platform module. This module periodically fetches monitoring metrics from Google Cloud Platform using Stackdriver Monitoring API for Google Cloud Platform services.
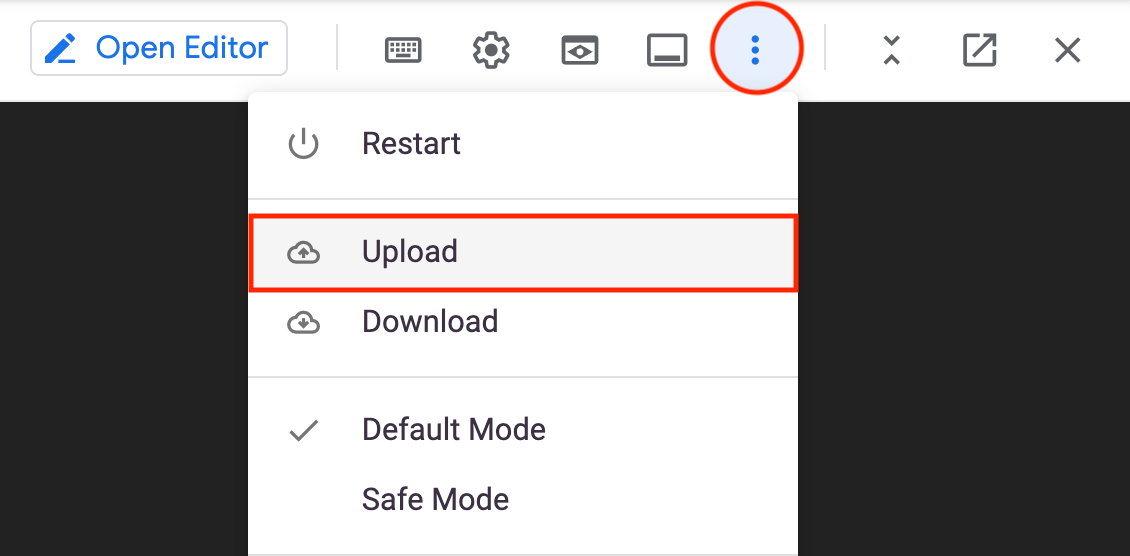
 ) on the navigation menu and select Upload.
Select your service account JSON key file (exported in the first section) and upload it to Cloud Shell. Note the location of the file as you will be using it in this section.
Next, run the following command to enable the Metricbeat GCP module.
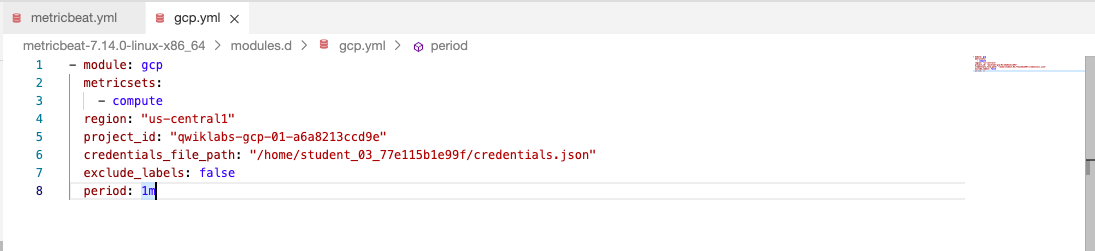
Navigate to the metricbeat folder then modules.d/gcp.yml file
Replace the entire contents of the file with the following configurations. Make sure to replace project_id and credentials_file_path with the your correct values:
credentials.json is the file that you generated earlier.
Your file should resemble the following:
Metricbeat will print Google Cloud metrics to the terminal, if the setup is correct.
After a few minutes or so, your dashboard should resemble the following:
![The [Metricbeat GCP] Compute Overview dashboard](https://cdn.qwiklabs.com/QK0TisYYDE6I3Disu5FX4KXQk6QsmOJzneXq2BsDB6M%3D)
Now that Metricbeat is up and running, configure Filebeat to collect Google Cloud logs.
Filebeat comes with predefined assets for parsing, indexing, and visualizing your data.
username:password in this command. To find your Cloud ID, click on your deployment.
nginx_ecs or apache_ecs. It's safe to ignore these and continue on with the lab.
Next, configure Filebeat output to Elasticsearch Service.
api_key and an id field, which can be stored in the Filebeat keystore in the following format: id:api_key:-n parameter; otherwise, you will have painful debugging sessions due to adding a newline at the end of your API key
filebeat.yml configuration file. Add the following lines to the end of the file:Now that the output is working, you are going to set up the input (Google Cloud).
If it is not working, verify that you used the right credentials and, if necessary, add them again.
To collect logs from Google Cloud, use the Google Cloud Platform module. This module periodically fetches logs that have been exported from Cloud Logging to a Pub/Sub topic sink. There are three available filesets: audit, vpcflow, firewall. This lab covers the audit fileset.
Use the search bar to find the Log Router page in Logging, where you'll configure Google Cloud to export logs to a Pub/Sub topic.
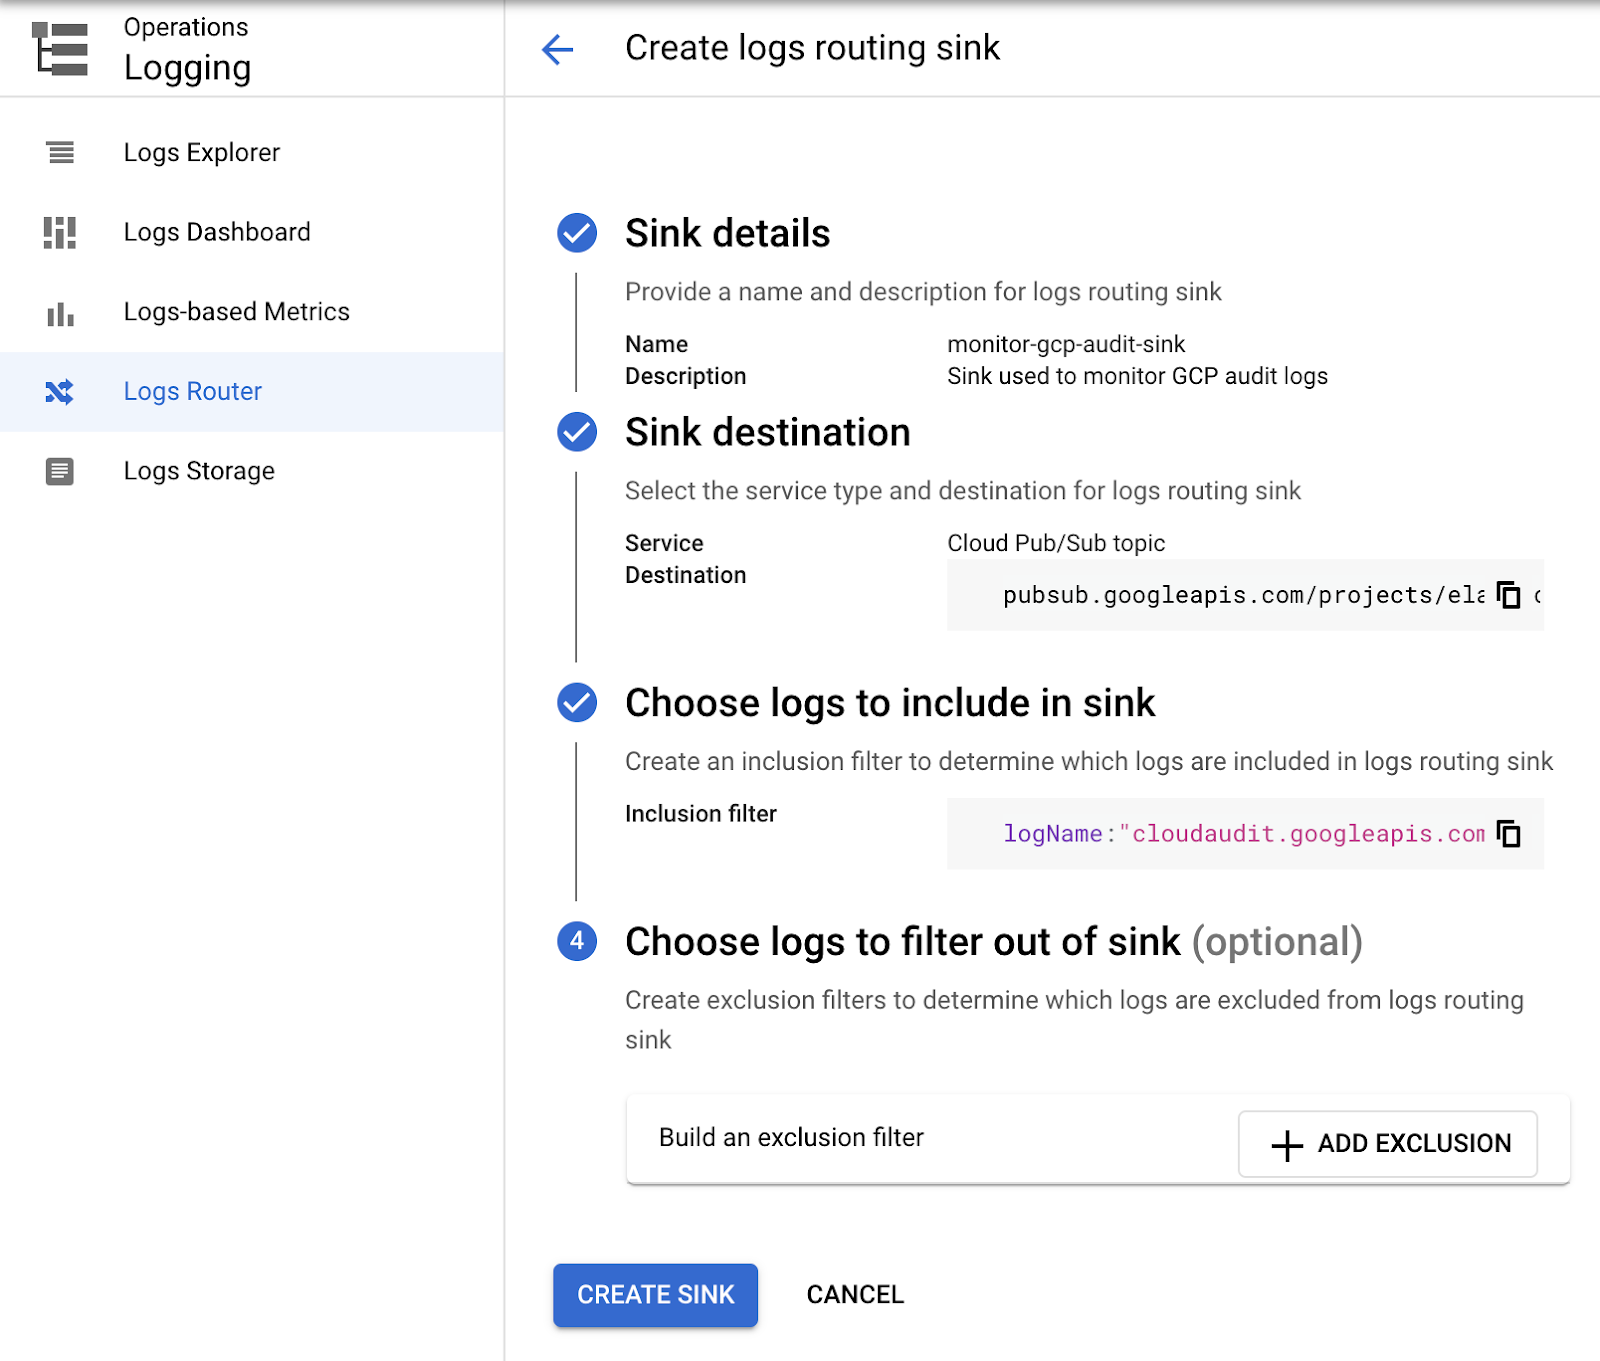
To set up the logs routing sink, click Create sink. Set sink name as monitor-gcp-audit-sink.
Click Next.
Under sink service select Cloud Pub/Sub topic and under select a cloud pub/sub topic click Create a Topic, enter monitor-gcp-audit as Topic id, then click Create Topic.
Click Next.
Finally, under Choose logs to include in sink, add logName:"cloudaudit.googleapis.com" (it includes all audit logs).
Click Create Sink. It will look something like the following:
Click Check my progress to verify the objective.
Navigate to the filebeat folder then to modules.d/gcp.yml file.
Replace the entire contents of the file with the following configurations. Make sure to update var.project_id and var.credentials_file with the your correct values:
After a few minutes, you should see incoming data in the dashboard.
Click Check my progress to verify the objective.
In this lab you created a deployment using Elastic Cloud, installed and configured Beats to send data to Elasticsearch, then finally used Kibana to visualize the ingested data.
...helps you make the most of Google Cloud technologies. Our classes include technical skills and best practices to help you get up to speed quickly and continue your learning journey. We offer fundamental to advanced level training, with on-demand, live, and virtual options to suit your busy schedule. Certifications help you validate and prove your skill and expertise in Google Cloud technologies.
Manual Last Updated: November 08, 2024
Lab Last Tested: November 08, 2024
Copyright 2025 Google LLC All rights reserved. Google and the Google logo are trademarks of Google LLC. All other company and product names may be trademarks of the respective companies with which they are associated.


현재 이 콘텐츠를 이용할 수 없습니다
이용할 수 있게 되면 이메일로 알려드리겠습니다.

감사합니다
이용할 수 있게 되면 이메일로 알려드리겠습니다.

One lab at a time
Confirm to end all existing labs and start this one