

Before you begin
- Labs create a Google Cloud project and resources for a fixed time
- Labs have a time limit and no pause feature. If you end the lab, you'll have to restart from the beginning.
- On the top left of your screen, click Start lab to begin
GMP deployment
/ 33
Prometheus metric
/ 33
Grafana data source
/ 34
With self-deployed data collections, you manage your Prometheus installation as usual. The only difference from upstream Prometheus is that you run the Managed Service for Prometheus drop-in replacement binary instead of the upstream Prometheus binary.
In this lab, you will explore how to use Managed Service for Prometheus in a self-deployed data collection mode. You can also utilize managed data collection as well.
In this lab, you will learn how to:
Read these instructions. Labs are timed and you cannot pause them. The timer, which starts when you click Start Lab, shows how long Google Cloud resources are made available to you.
This hands-on lab lets you do the lab activities in a real cloud environment, not in a simulation or demo environment. It does so by giving you new, temporary credentials you use to sign in and access Google Cloud for the duration of the lab.
To complete this lab, you need:
Click the Start Lab button. If you need to pay for the lab, a dialog opens for you to select your payment method. On the left is the Lab Details pane with the following:
Click Open Google Cloud console (or right-click and select Open Link in Incognito Window if you are running the Chrome browser).
The lab spins up resources, and then opens another tab that shows the Sign in page.
Tip: Arrange the tabs in separate windows, side-by-side.
If necessary, copy the Username below and paste it into the Sign in dialog.
You can also find the Username in the Lab Details pane.
Click Next.
Copy the Password below and paste it into the Welcome dialog.
You can also find the Password in the Lab Details pane.
Click Next.
Click through the subsequent pages:
After a few moments, the Google Cloud console opens in this tab.

Cloud Shell is a virtual machine that is loaded with development tools. It offers a persistent 5GB home directory and runs on the Google Cloud. Cloud Shell provides command-line access to your Google Cloud resources.
Click Activate Cloud Shell 
Click through the following windows:
When you are connected, you are already authenticated, and the project is set to your Project_ID,
gcloud is the command-line tool for Google Cloud. It comes pre-installed on Cloud Shell and supports tab-completion.
Output:
Output:
gcloud, in Google Cloud, refer to the gcloud CLI overview guide.
2.. Create namespace gmp-test:
This example application emits Prometheus metrics on its metrics port. The application uses three replicas.
If the deployment was successful then you should see a similar output to the following. Wait for the status of all pods to be Running.
Run the following commands to verify that you can see metrics by using the Prometheus metrics API.
Log in to Grafana using the username admin and password admin.
Click Skip when asked to enter new password.
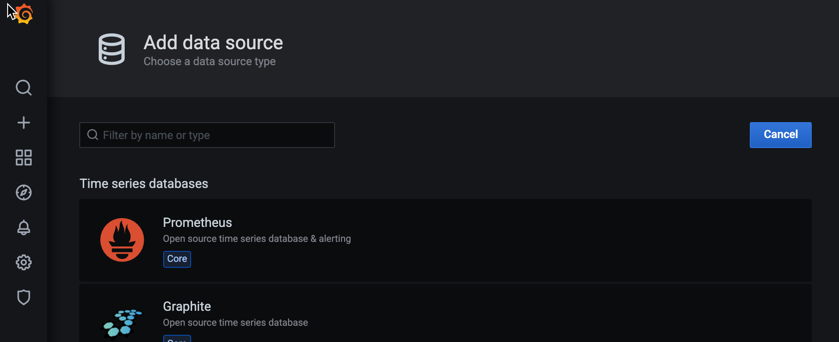
To query Managed Service for Prometheus in Grafana by using the Prometheus UI as the authentication proxy, you must add new data source to Grafana. To add a data source for the managed service, do the following:
Go to your Grafana deployment, for example, by browsing to the URL http://localhost:3000 to reach the Grafana welcome page.
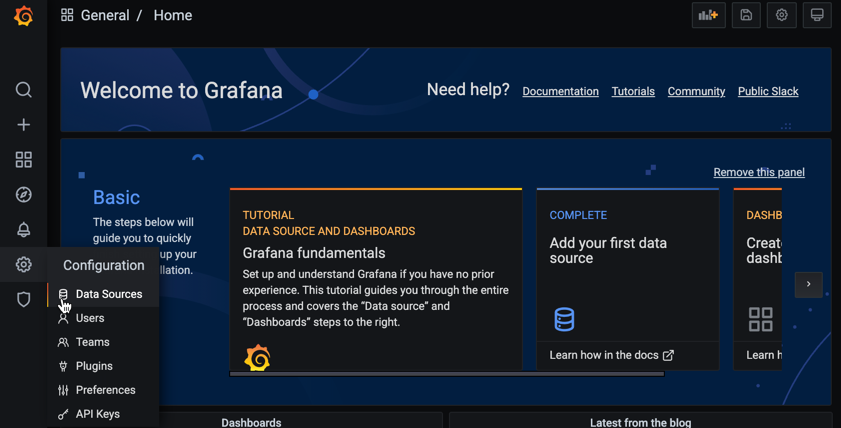
Select Configuration from the main Grafana menu, then select Data Sources.
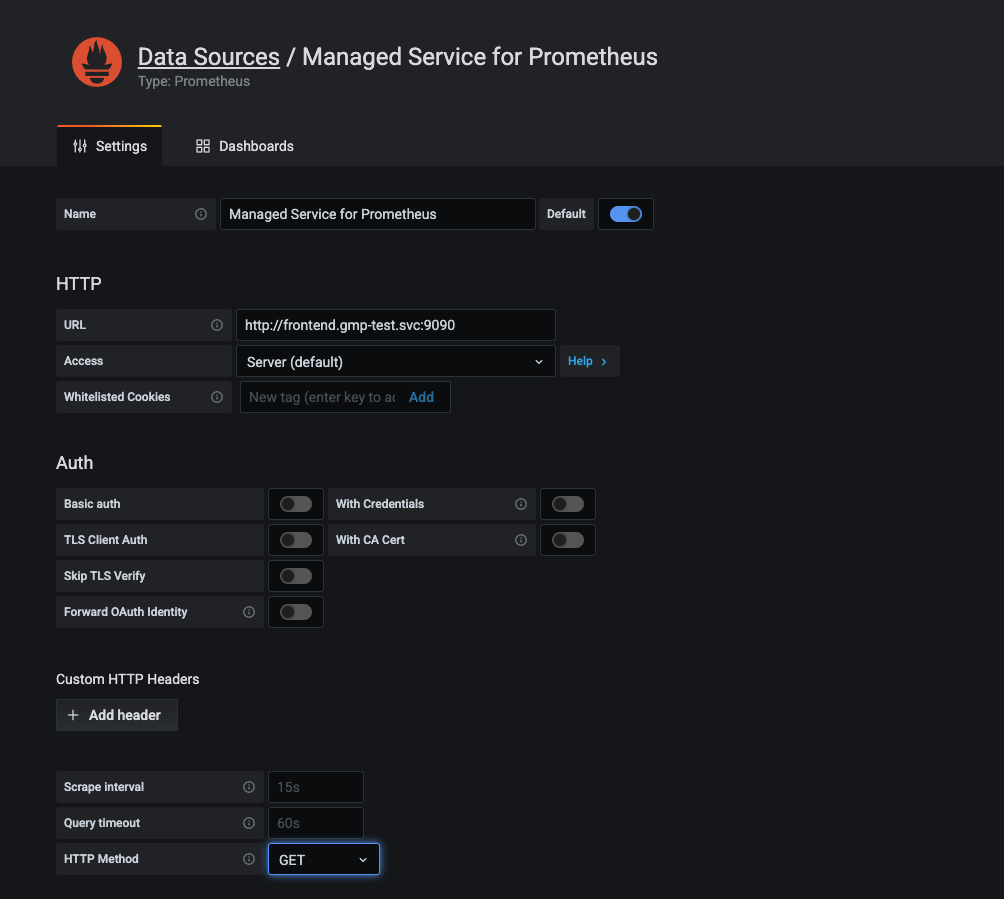
In the URL field of the HTTP pane, enter the URL of the Managed Service for Prometheus frontend service. If you configured the Prometheus UI to run on port 9090, then the service URL for this field is http://frontend.gmp-test.svc:9090.
In the HTTP Method field, select GET.
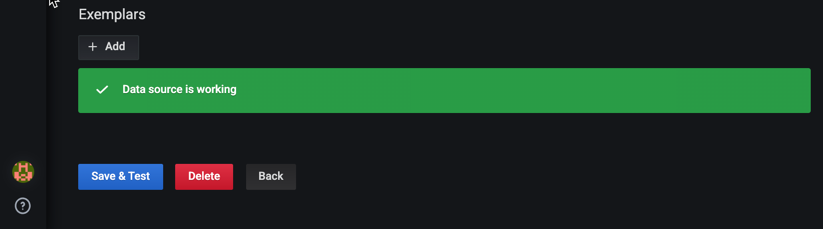
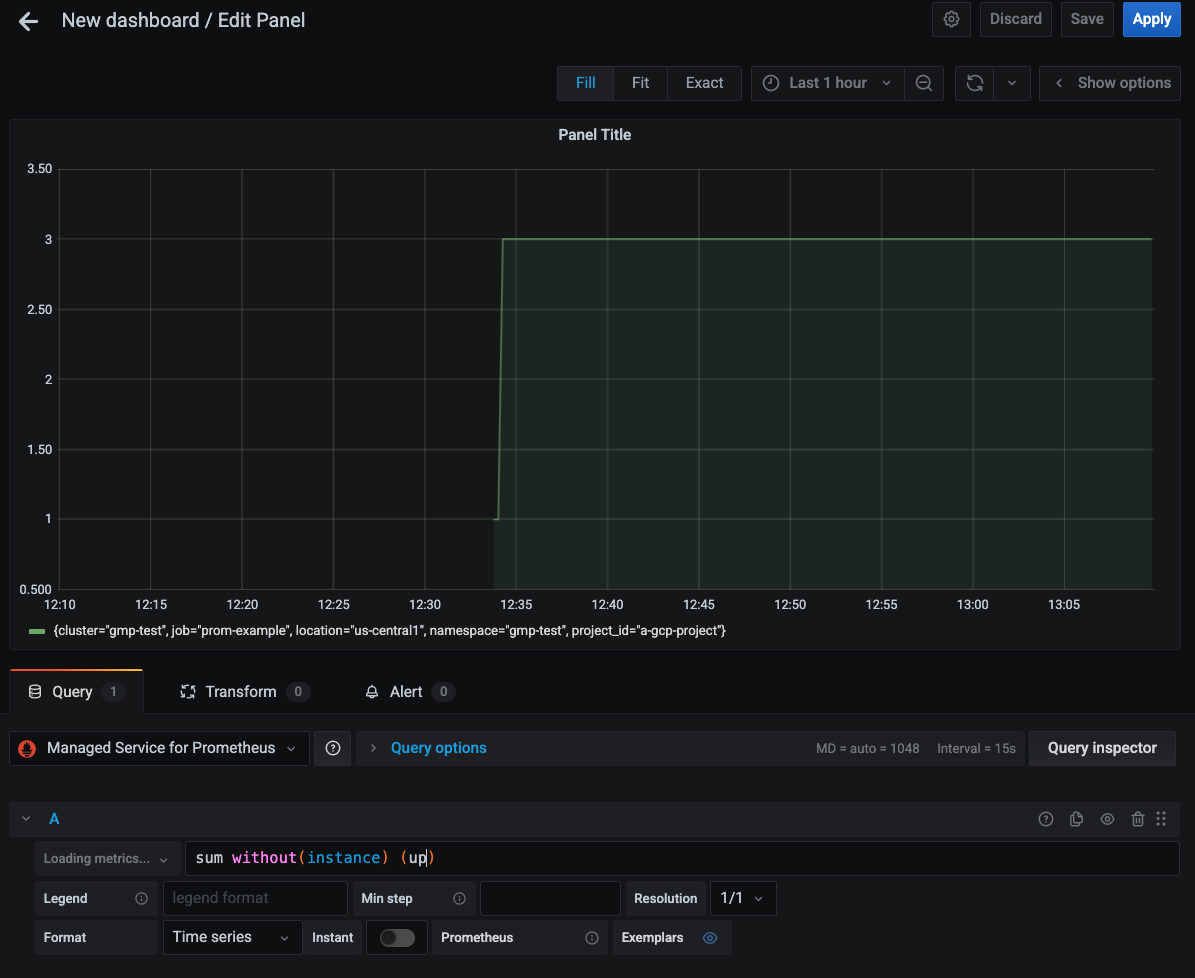
You can now create Grafana dashboards using the new data source. You can also redirect existing dashboards to the new data source. The following screenshot shows a Grafana chart that displays the up metric.
You have learned how to deploy the Managed Service for Prometheus, create a self-managed data collection for scraping metrics, and use Grafana to query Prometheus metrics data.
Find more information on considerations to make when choosing a managed vs. self-managed data collection in the Data collection with Managed Service for Prometheus documentation
...helps you make the most of Google Cloud technologies. Our classes include technical skills and best practices to help you get up to speed quickly and continue your learning journey. We offer fundamental to advanced level training, with on-demand, live, and virtual options to suit your busy schedule. Certifications help you validate and prove your skill and expertise in Google Cloud technologies.
Manual Last Updated April 18, 2024
Lab Last Tested October 17, 2023
Copyright 2025 Google LLC All rights reserved. Google and the Google logo are trademarks of Google LLC. All other company and product names may be trademarks of the respective companies with which they are associated.


Konten ini tidak tersedia untuk saat ini
Kami akan memberi tahu Anda melalui email saat konten tersedia

Bagus!
Kami akan menghubungi Anda melalui email saat konten tersedia

One lab at a time
Confirm to end all existing labs and start this one