チェックポイント
Deploy the exported Cosmetic Inspection anomaly detection solution artifact
/ 20
Identify defective product
/ 40
Identify non-defective product
/ 40
Deploy and Test a Visual Inspection AI Cosmetic Anomaly Detection Solution
GSP898

Overview
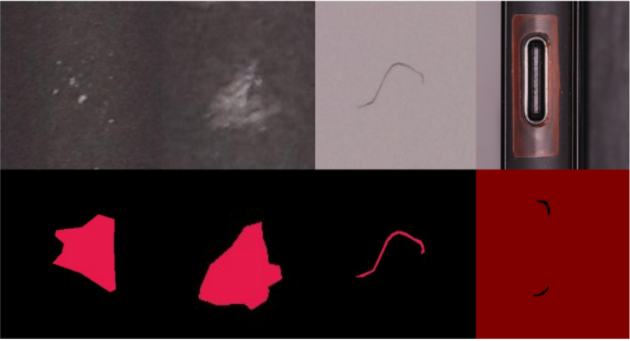
Visual Inspection AI Cosmetic Inspection inspects products to detect and recognize defects such as dents, scratches, cracks, deformations, foreign materials, etc. on any kind of surface such as those shown in the following image.
In this lab, you will deploy a pre-prepared Cosmetic Inspection anomaly detection solution artifact and use it to analyze sample images.
Model training can take a long time, so this lab is paired with Creating a Cosmetic Anomaly Detection Model using Visual Inspection AI. You are provided with the trained Cosmetic Inspection anomaly detection solution artifact that was created using the same dataset used in that lab.
Objectives
In this lab you will learn how to complete the following tasks:
- Deploy a trained Cosmetic Inspection anomaly detection solution artifact.
- Perform batch prediction using an Cosmetic Inspection anomaly detection solution artifact.
Setup and requirements
Before you click the Start Lab button
Read these instructions. Labs are timed and you cannot pause them. The timer, which starts when you click Start Lab, shows how long Google Cloud resources will be made available to you.
This hands-on lab lets you do the lab activities yourself in a real cloud environment, not in a simulation or demo environment. It does so by giving you new, temporary credentials that you use to sign in and access Google Cloud for the duration of the lab.
To complete this lab, you need:
- Access to a standard internet browser (Chrome browser recommended).
- Time to complete the lab---remember, once you start, you cannot pause a lab.
How to start your lab and sign in to the Google Cloud console
-
Click the Start Lab button. If you need to pay for the lab, a pop-up opens for you to select your payment method. On the left is the Lab Details panel with the following:
- The Open Google Cloud console button
- Time remaining
- The temporary credentials that you must use for this lab
- Other information, if needed, to step through this lab
-
Click Open Google Cloud console (or right-click and select Open Link in Incognito Window if you are running the Chrome browser).
The lab spins up resources, and then opens another tab that shows the Sign in page.
Tip: Arrange the tabs in separate windows, side-by-side.
Note: If you see the Choose an account dialog, click Use Another Account. -
If necessary, copy the Username below and paste it into the Sign in dialog.
{{{user_0.username | "Username"}}} You can also find the Username in the Lab Details panel.
-
Click Next.
-
Copy the Password below and paste it into the Welcome dialog.
{{{user_0.password | "Password"}}} You can also find the Password in the Lab Details panel.
-
Click Next.
Important: You must use the credentials the lab provides you. Do not use your Google Cloud account credentials. Note: Using your own Google Cloud account for this lab may incur extra charges. -
Click through the subsequent pages:
- Accept the terms and conditions.
- Do not add recovery options or two-factor authentication (because this is a temporary account).
- Do not sign up for free trials.
After a few moments, the Google Cloud console opens in this tab.

Activate Cloud Shell
Cloud Shell is a virtual machine that is loaded with development tools. It offers a persistent 5GB home directory and runs on the Google Cloud. Cloud Shell provides command-line access to your Google Cloud resources.
- Click Activate Cloud Shell
at the top of the Google Cloud console.
When you are connected, you are already authenticated, and the project is set to your Project_ID,
gcloud is the command-line tool for Google Cloud. It comes pre-installed on Cloud Shell and supports tab-completion.
- (Optional) You can list the active account name with this command:
- Click Authorize.
Output:
- (Optional) You can list the project ID with this command:
Output:
gcloud, in Google Cloud, refer to the gcloud CLI overview guide.
Task 1. Deploy the exported Cosmetic Inspection anomaly detection solution artifact
A solution container from Creating a Cosmetic Anomaly Detection Model using Visual Inspection AI is stored in the Container Registry (gcr.io) location. You can deploy the exported solution container in your own environment, whether that is a Google Cloud VM or in an on-premise compute unit.
Run and test a CPU-based solution artifact locally
In this task, you will deploy an exported assembly inspection solution artifact by running it as a container using Docker in Google Cloud VM, that is created for you. The process shown here uses docker commands to pull, or start the Docker compatible solution artifact container.
The exported solution artifact container uses port 8601 for grpc traffic, port 8602 for http traffic, and port 8603 for Prometheus metric traffic. You can map these ports to locally available ports in the VM environment when starting the container with Docker using the command line switches -v 9000:8602 or -v 3006:8603.
You need to map a local port to port 8602 for sending http requests, and another local port to port 8603 if you want to see the metrics logs locally.
- Your first step is to connect to the Google Cloud VM. In Cloud Shell, run the following command to connect to the VM:
-
Type
Yto continue. -
For any prompts, press Enter to continue.
Define an environment variable to store the name of the Visual Inspection solution artifact Docker image that is stored in Container Registry.
- In the terminal, define a variable named DOCKER_TAG using the full image name of the docker container:
This is the Container Registry image ID of a Visual Inspection Cosmetic Inspection anomaly detection solution artifact that was trained using the Visual Inspection cosmetic defect demo dataset. This solution artifact will identify cosmetic defects in images.
- Define variables for ports used by the solution artifact container:
- Pull the docker image from the Google Source Repository using the following command:
- Start the solution artifact locally using Docker in the VM:
The reported usage metrics uploaded from the container include:
-
num_request_processed: the total number of processed requests. -
prediction_latency: the prediction latency in one request. -
average_prediction_latency: the average prediction latency.
- Confirm that the container is running:
You should see a container listed that has the image name for your solution artifact.
Once you have started the solution artifact container with the above Docker run command, you can send requests to the running container using the python script below.
- Copy the file
prediction_script.pyto run predictions by calling Visual Inspection AI rest APIs via the solution artifact container:
The code in this file is displayed below for your reference.
Click Check my progress to verify the objective.
Task 2. Serve the exported assembly inspection solution artifact
Identifying a defective product
- In the VM terminal, run the commands below to copy training images to your Cloud Storage bucket, followed by copying a defective sample image to the VM:
-
Next, find a defective product from the cloud storage bucket. In the cloud console, go to Navigation menu > Cloud Storage > Buckets.
-
In the Cloud Storage, navigate to the bucket named
> cosmetic-test-data. -
Now find and click on the image named
IMG_07703.pngfrom the list of the images. You might have to scroll through the list to find this image.
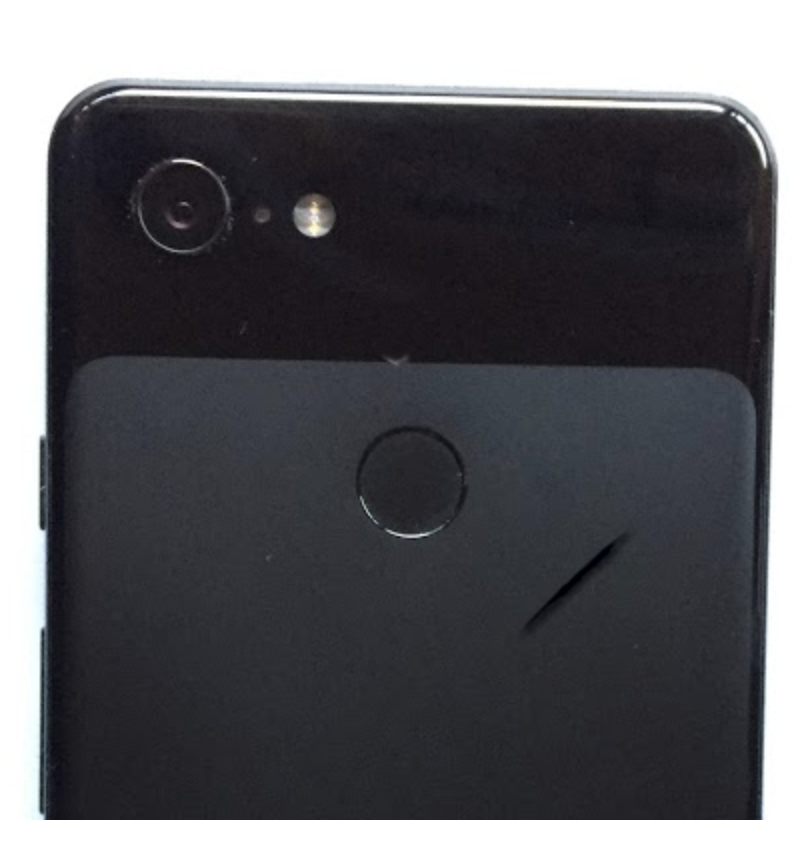
This is an image of a defective product that has a scratch on the surface.
- In the terminal, run the following commands to install the python envrionment and packages:
- In the terminal, run the following command to send the selected image as a request to the solution artifact container:
This will print out the JSON result data returned by your Visual Inspection AI model. You can inspect the annotation sets and annotations to see that this returns the same data structures that are returned when batch predictions are performed using the UI.
However this sample image is one of the images with a cosmetic defect. If you look at the annotation results, you can see that Visual Inspection AI has identified a scratch in this particular image.
The script also stores the prediction result in a file named def_prediction_result.json that is created and saved in the HOME directory of the VM. This file is passed to the script using the flag --output_result_file.
- Run the following command to send multiple requests to the running container:
The script calls the solution artifact 10 times and reports the distribution of the response latencies that are returned in the response each time the solution artifact processes an image. The script also stores the latency result in a file named def_latency_result.json that is created and saved in the HOME directory of the VM. This file is passed to the script using the flag --output_result_file.
Click Check my progress to verify the objective.
Identifying a non-defective product
- In the VM terminal, run the commands below to copy a non-defective sample image to the VM:
-
Next, find a non-defective product from the cloud storage bucket. If you are not in Cloud Storage browser, in cloud console, go to Navigation menu (
) > Cloud Storage > Buckets. In the Cloud Storage Browser, navigate to the bucket named
> cosmetic-test-data. -
Now find and click on the image named
IMG_0769.pngfrom the list of the images. You might have to scroll through the list to find this image.
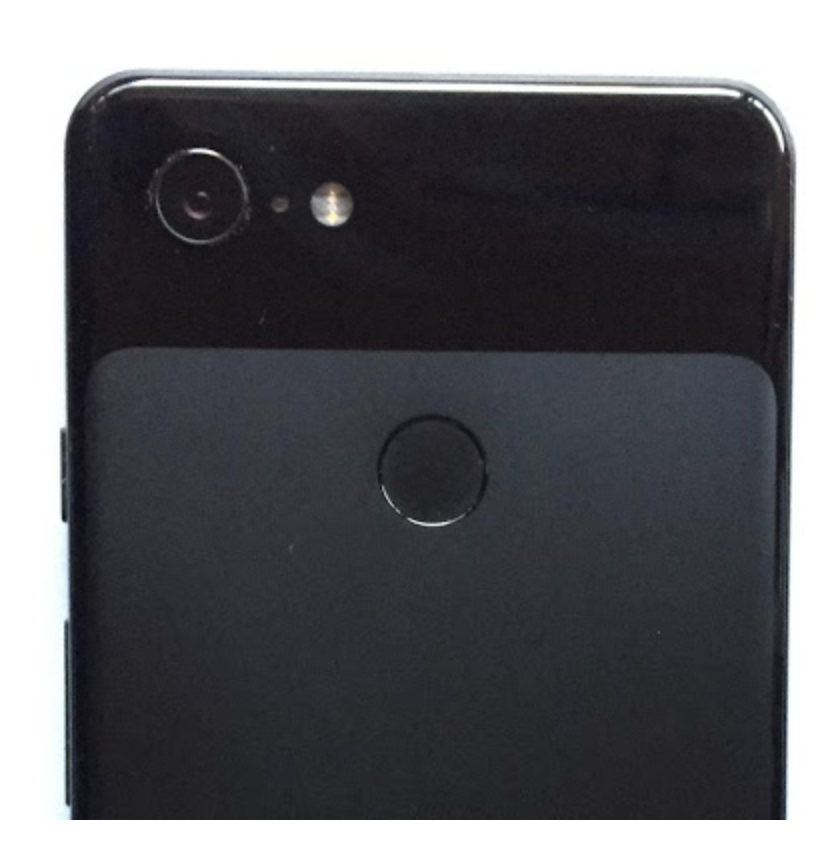
This is a non-defective product that does not have any defects.
- In the terminal, run the following command to send the selected image as a request to the solution artifact container:
This will print out the JSON result data returned by your Visual Inspection AI model. You can inspect the annotation sets and annotations to see that this returns the same general data structures that were returned in the previous prediction.
However this sample image does not have any cosmetic defects present. If you look at the annotation results, you can see that Visual Inspection AI has not identified any region with either of the two defect types this model has been trained to identify, scratches or dents.
The script also stores the prediction result in a file named non_def_prediction_result.json that is created and saved in the HOME directory of the VM. This file is passed to the script using the flag --output_result_file.
- Run the following command in the VM terminal to send multiple requests to the running container:
The script calls the solution artifact 10 times and reports the distribution of the response latencies that are returned in the response each time the solution artifact processes an image.
The script also stores the latency result in a file named non_def_latency_result.json that is created and saved in the HOME directory of the VM. This file is passed to the script using the flag --output_result_file.
Click Check my progress to verify the objective.
Congratulations!
Congratulations! In this lab, you deployed a pre-prepared Cosmetic Inspection anomaly detection solution artifact and used it to analyze sample images. You also learned how to perform batch prediction using an Cosmetic Inspection anomaly detection solution artifact.
Google Cloud training and certification
...helps you make the most of Google Cloud technologies. Our classes include technical skills and best practices to help you get up to speed quickly and continue your learning journey. We offer fundamental to advanced level training, with on-demand, live, and virtual options to suit your busy schedule. Certifications help you validate and prove your skill and expertise in Google Cloud technologies.
Manual Last Updated July 17, 2024
Lab Last September July 17, 2024
Copyright 2024 Google LLC All rights reserved. Google and the Google logo are trademarks of Google LLC. All other company and product names may be trademarks of the respective companies with which they are associated.

