

Before you begin
- Labs create a Google Cloud project and resources for a fixed time
- Labs have a time limit and no pause feature. If you end the lab, you'll have to restart from the beginning.
- On the top left of your screen, click Start lab to begin
Deploy the cluster and required resources using Terraform
/ 50
Teardown (Clean-up)
/ 50
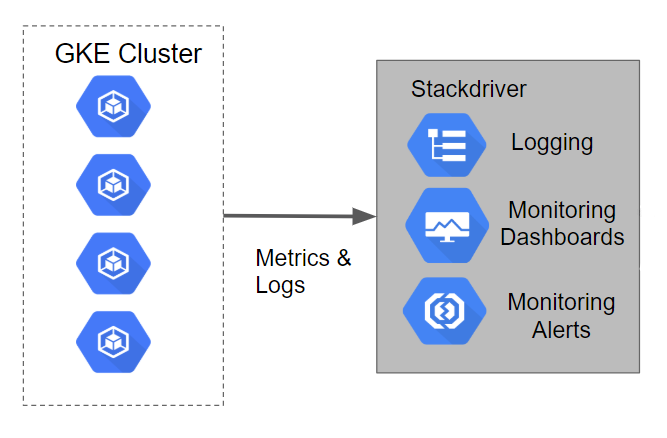
Kubernetes Engine Monitoring is a new Cloud Monitoring feature that more tightly integrates with GKE to better show you key stats about your cluster and the workloads and services running in it. Included in the new feature is functionality to import, as native Cloud Monitoring metrics, metrics from pods with Prometheus endpoints. This allows you to use Cloud Monitoring native alerting functionality with your Prometheus metrics without any additional workload.
In this lab you will set up Monitoring and visualizing metrics from a Kubernetes Engine cluster. It makes use of Terraform, a declarative Infrastructure as Code tool that enables configuration files to be used to automate the deployment and evolution of infrastructure in the cloud. The logs from the Kubernetes Engine cluster will be leveraged to walk through the monitoring capabilities of Cloud Monitoring.
This lab was created by GKE Helmsman engineers to help you grasp a better understanding of Cloud Monitoring with Kubernetes Engine. You can view this demo on Github. We encourage any and all to contribute to our assets!
This lab will create a Kubernetes Engine cluster that has a sample application deployed to it. The logging and metrics for the cluster are loaded into Cloud Logging by default. In the tutorial, a Cloud Monitoring account will be set up to view the metrics captured.
Read these instructions. Labs are timed and you cannot pause them. The timer, which starts when you click Start Lab, shows how long Google Cloud resources are made available to you.
This hands-on lab lets you do the lab activities in a real cloud environment, not in a simulation or demo environment. It does so by giving you new, temporary credentials you use to sign in and access Google Cloud for the duration of the lab.
To complete this lab, you need:
Click the Start Lab button. If you need to pay for the lab, a dialog opens for you to select your payment method. On the left is the Lab Details pane with the following:
Click Open Google Cloud console (or right-click and select Open Link in Incognito Window if you are running the Chrome browser).
The lab spins up resources, and then opens another tab that shows the Sign in page.
Tip: Arrange the tabs in separate windows, side-by-side.
If necessary, copy the Username below and paste it into the Sign in dialog.
You can also find the Username in the Lab Details pane.
Click Next.
Copy the Password below and paste it into the Welcome dialog.
You can also find the Password in the Lab Details pane.
Click Next.
Click through the subsequent pages:
After a few moments, the Google Cloud console opens in this tab.

Cloud Shell is a virtual machine that is loaded with development tools. It offers a persistent 5GB home directory and runs on the Google Cloud. Cloud Shell provides command-line access to your Google Cloud resources.
Click Activate Cloud Shell 
Click through the following windows:
When you are connected, you are already authenticated, and the project is set to your Project_ID,
gcloud is the command-line tool for Google Cloud. It comes pre-installed on Cloud Shell and supports tab-completion.
Output:
Output:
gcloud, in Google Cloud, refer to the gcloud CLI overview guide.
Permission denied when running Terraform, it's probably because the credentials that Terraform is using do not provide the necessary permissions to create resources in the selected project. Ensure that the account listed in gcloud config list has the necessary permissions to create resources. If it does, regenerate the application default credentials using gcloud auth application-default login.
Certain Compute Engine resources live in regions and zones. A region is a specific geographical location where you can run your resources. Each region has one or more zones.
Run the following to set a region and zone for your lab (you can use the region/zone that's best for you):
The Terraform configuration will execute against your Google Cloud environment and create a Kubernetes Engine cluster running a simple application. The configuration will use your personal account to build out these resources. In this lab, you use Cloud Shell which automatically has your project and student account configured and authenticated.
Set up a Monitoring Metrics Scope that's tied to your Google Cloud Project. The following steps create a new account that has a free trial of Monitoring.
 ) > View All Products > Observability > Monitoring.
When the Monitoring Overview page opens, your metrics scope project is ready.
If you need to override any of the defaults in the Terraform variables file, simply replace the desired value(s) to the right of the equals sign(s). Be sure your replacement values are still double-quoted.
./terraform/terraform.tfvars for Terraform variables.
* ./manifests/prometheus-service-sed.yaml for the Prometheus policy to be created in Cloud Monitoring.
2. Run terraform init to prepare Terraform to create the infrastructure
3. Run terraform apply to actually create the infrastructure & Cloud Monitoring alert policy
If no errors are displayed then after a few minutes you should see an output as below.
Example output:
You can verify created Kubernetes Engine cluster in the Cloud Console.
Click Check my progress to verify your performed task. If you have successfully deployed resources using Terraform, you will see an assessment score.
Following the principles of Infrastructure as Code and Immutable Infrastructure, Terraform supports the writing of declarative descriptions of the desired state of infrastructure. When the descriptor is applied, Terraform uses Google Cloud APIs to provision and update resources to match. Terraform compares the desired state with the current state so incremental changes can be made without deleting everything and starting over. For instance, Terraform can build out Google Cloud projects and compute instances, etc., even set up a Kubernetes Engine cluster and deploy applications to it. When requirements change, the descriptor can be updated and Terraform will adjust the cloud infrastructure accordingly.
This demo script will start up a Kubernetes Engine cluster and deploy a simple sample application to it. By default, Kubernetes Engine clusters in Google Cloud are provisioned with a pre-configured Fluentd-based collector that forwards logs to Cloud Monitoring.
While you're waiting for the cluster to finish creating, read through this guide on how to observe your cluster with the new Kubernetes Engine Monitoring UI, see Observing Your Kubernetes Clusters.
If no errors are displayed during deployment, after a few minutes you should see your Kubernetes Engine cluster in the Cloud Console with the sample application deployed.
You can click on Kubernetes Engine to monitor the progress.
In order to validate that resources are installed and working correctly, run:
Example output:
The Terraform code included a Cloud Monitoring alerting policy that is watching a metric that was originally imported from a Prometheus endpoint.
Still in the Cloud Monitoring window, in the left menu, click Alerting. The Policies section lists all the policies, including the alerting policy called Prometheus mem alloc.
Clicking on the policy provides much more detail.
After the scripts execute it may take a few minutes for the Metrics to appear on the Overview page. Refresh your page periodically to make sure that you're seeing the latest updates.
You will eventually see an Incident when the mem alloc above 12 policy gets violated.
This command uses the terraform destroy command to remove the infrastructure. Terraform tracks the resources it creates so it can tear them all backdown.
If no errors are displayed then after a few minutes you should see an output as below (do not move forward until you get the output as below).
Example output:
Click Check my progress to verify your performed task. If you have successfully removed the infrastructure using Terraform, you will see an assessment score.
...helps you make the most of Google Cloud technologies. Our classes include technical skills and best practices to help you get up to speed quickly and continue your learning journey. We offer fundamental to advanced level training, with on-demand, live, and virtual options to suit your busy schedule. Certifications help you validate and prove your skill and expertise in Google Cloud technologies.
Manual Last Updated September 29, 2023
Lab Last Tested September 29, 2023
Copyright 2024 Google LLC. This software is provided as-is, without warranty or representation for any use or purpose. Your use of it is subject to your agreement with Google.


Ce contenu n'est pas disponible pour le moment
Nous vous préviendrons par e-mail lorsqu'il sera disponible

Parfait !
Nous vous contacterons par e-mail s'il devient disponible

One lab at a time
Confirm to end all existing labs and start this one