

Before you begin
- Labs create a Google Cloud project and resources for a fixed time
- Labs have a time limit and no pause feature. If you end the lab, you'll have to restart from the beginning.
- On the top left of your screen, click Start lab to begin
Create a reports dataset in BigQuery
/ 30
Query to pull the data for last year
/ 40
Create new data sources in Looker Studio
/ 30
For as long as business intelligence (BI) has been around, visualization tools have played an important role in helping analysts and decision-makers quickly get insights from data. In this lab, you'll step into the shoes of a tree services manager for a large city. Your mission: build a powerful dashboard using Looker Studio and BigQuery to uncover valuable insights hidden within your large tree service usage logs. This dashboard will help you make informed, data-backed decisions to optimize your operations.
Why is this important? Visualizations turn raw data into actionable insights. With a well-designed dashboard, you'll quickly identify trends, spot potential issues, and make strategic choices that can improve efficiency and service quality. This lab assumes some familiarity with BigQuery and Looker Studio. For more information, review the background docs (BigQuery concepts, Looker Studio overview).
In this lab, you will learn how to:
Read these instructions. Labs are timed and you cannot pause them. The timer, which starts when you click Start Lab, shows how long Google Cloud resources are made available to you.
This hands-on lab lets you do the lab activities in a real cloud environment, not in a simulation or demo environment. It does so by giving you new, temporary credentials you use to sign in and access Google Cloud for the duration of the lab.
To complete this lab, you need:
Click the Start Lab button. If you need to pay for the lab, a dialog opens for you to select your payment method. On the left is the Lab Details pane with the following:
Click Open Google Cloud console (or right-click and select Open Link in Incognito Window if you are running the Chrome browser).
The lab spins up resources, and then opens another tab that shows the Sign in page.
Tip: Arrange the tabs in separate windows, side-by-side.
If necessary, copy the Username below and paste it into the Sign in dialog.
You can also find the Username in the Lab Details pane.
Click Next.
Copy the Password below and paste it into the Welcome dialog.
You can also find the Password in the Lab Details pane.
Click Next.
Click through the subsequent pages:
After a few moments, the Google Cloud console opens in this tab.

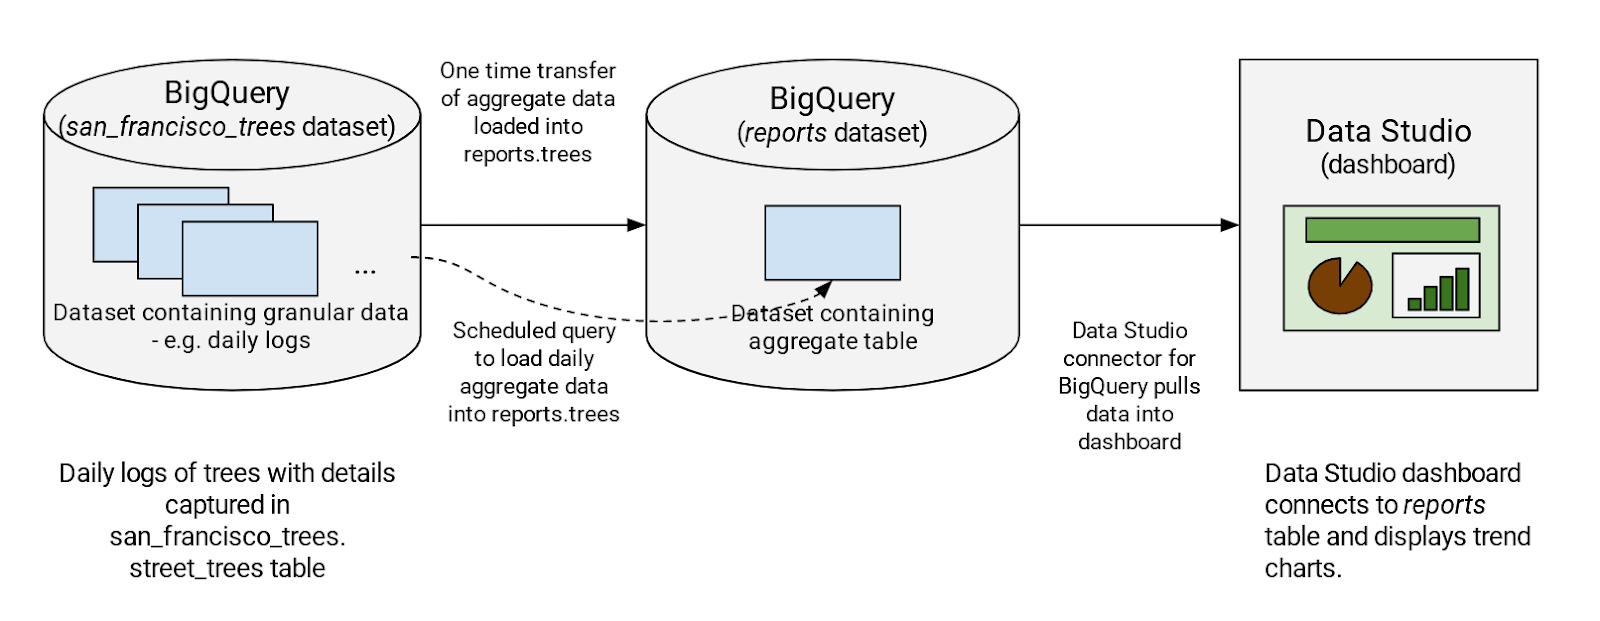
Typically, a dashboard shows an aggregated view of usage — it doesn't need details all the way to the level of an order ID, for instance. So, to reduce query costs, you'll first aggregate your needed logs into another dataset called "Reports" then create a table of aggregated data. You'll query the table from the Data Studio dashboard. This way, when your dashboard is refreshed, the reporting dataset queries process less data. Since usage logs from the past never change, you'll only refresh new usage data into the Reports dataset.
In this section, you pull in some public data so you can practice running SQL commands in BigQuery.
The Welcome to BigQuery in the Cloud Console message box opens. This message box provides a link to the quickstart guide and the release notes.
The BigQuery console opens.
Click + ADD in the explorer section, then select Public Datasets.
Search for "trees" and press Enter.
Click on the Street Trees tile, then click View Dataset.
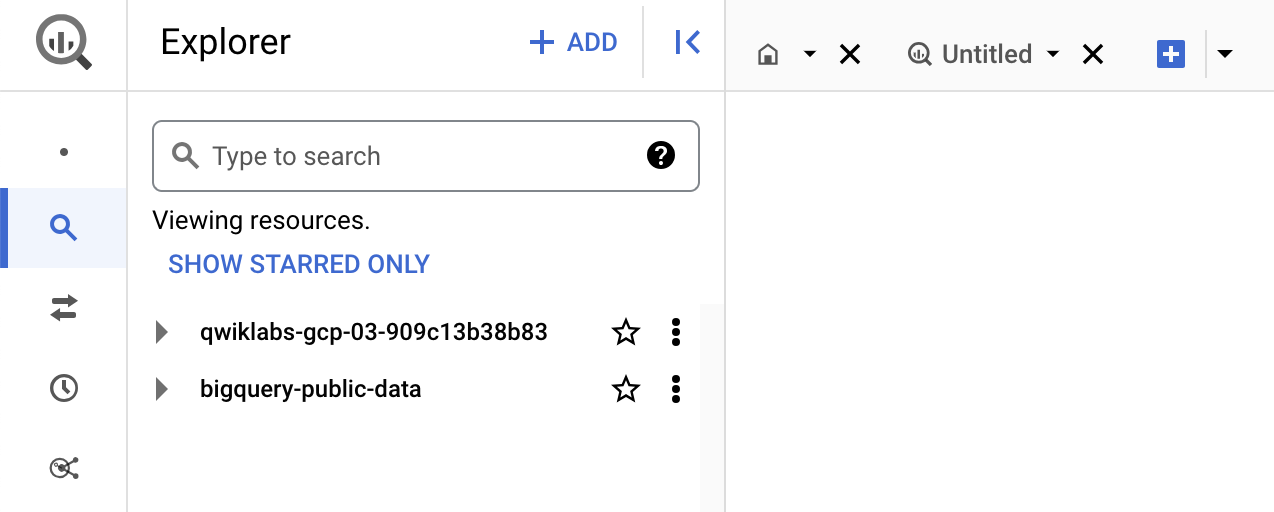
A new tab opens, a new project called bigquery-public-data is added to the Explorer panel:
bigquery-public-data doesn't appear to the Explorer panel, then click on + ADD > Star a project > Enter project name (bigquery-public-data) and STAR.
Next you'll create a new dataset called Reports in your project. A separate dataset has a couple of benefits: it reduces the amount of data queried by the dashboard, and it removes unnecessary access to your source datasets by users who are only interested in aggregated data.
Click the three dots next to your Qwiklabs project ID and select Create dataset.
Name your dataset Reports.
Leave the other options at their default values.
Click Check my progress to verify the objective.
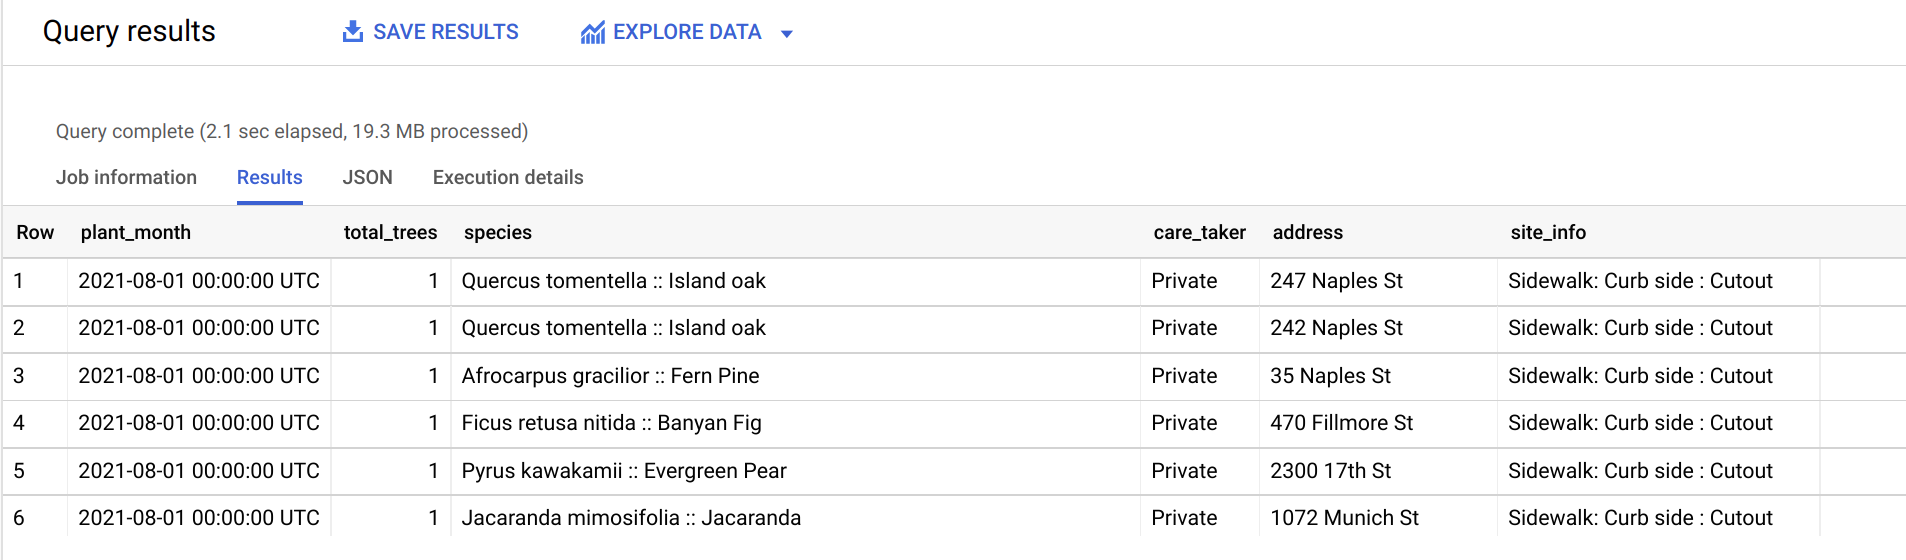
In this section, you will run a one-time query to pull the data for the last year, summarizing:
Open the Query editor by clicking the + button on the top of the BigQuery Console.
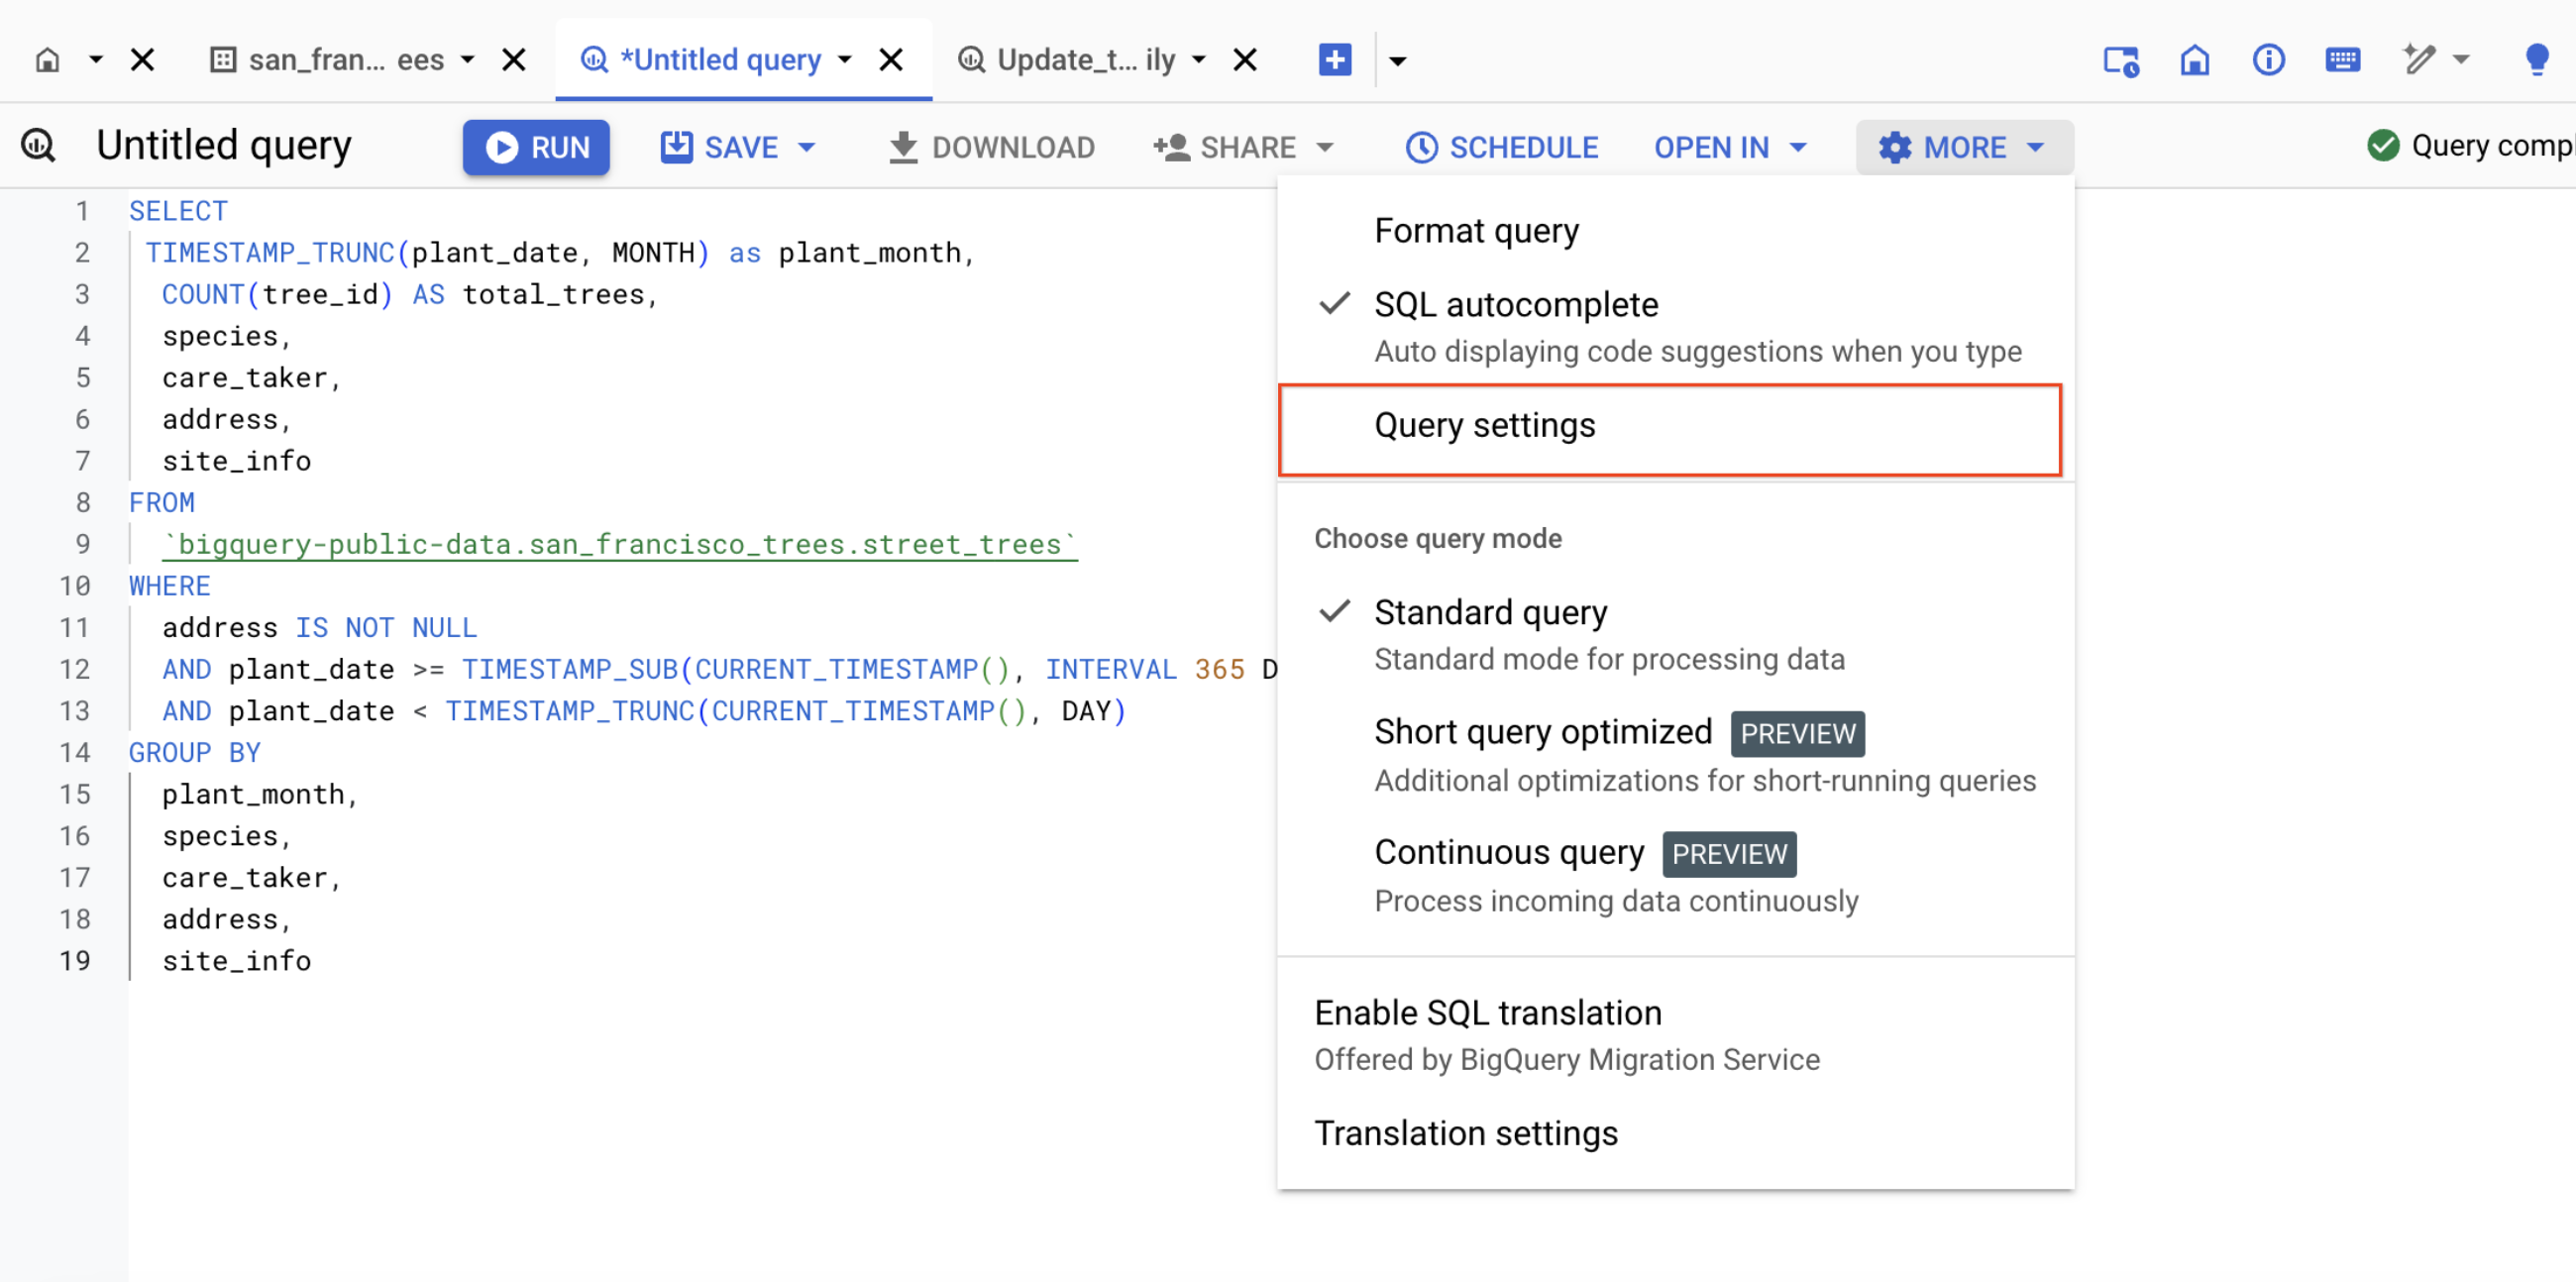
Add the following to the Query Editor:
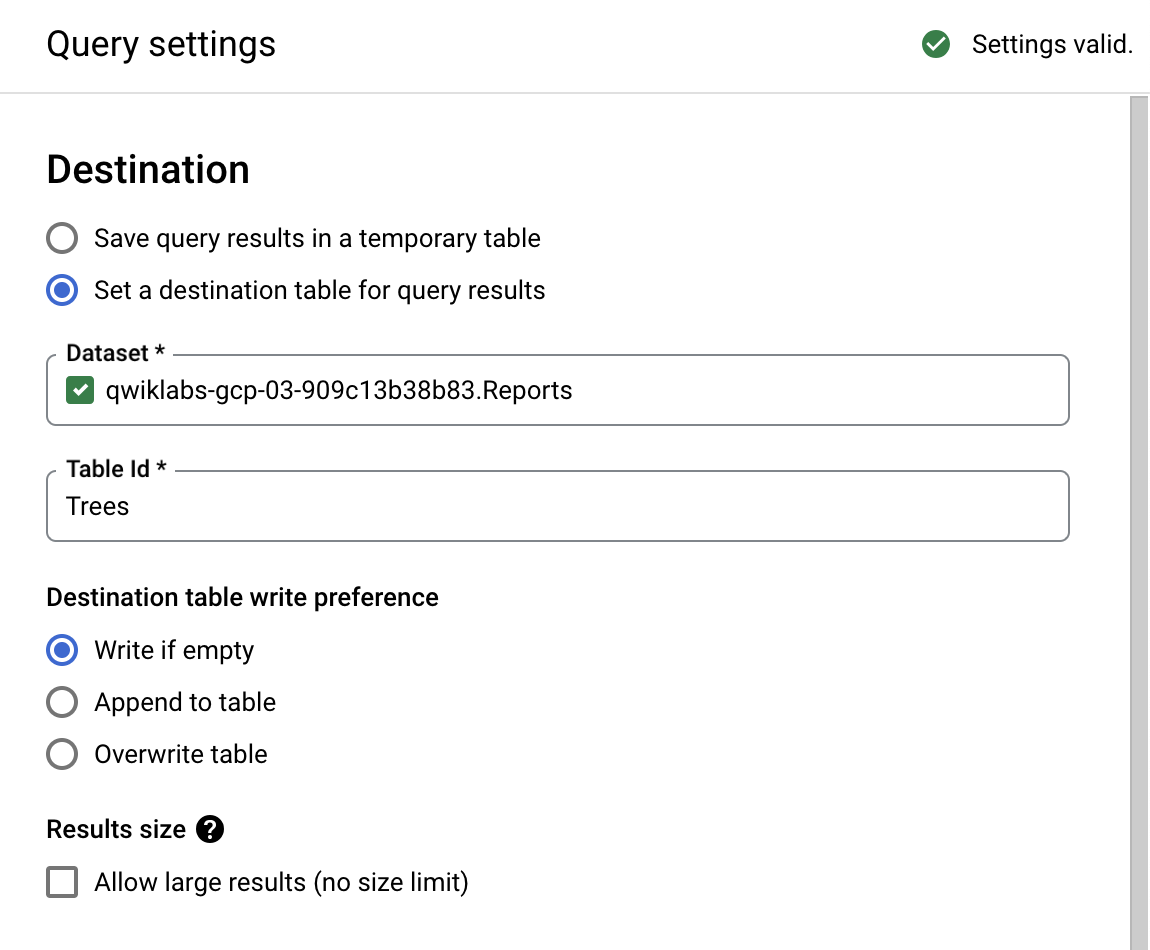
Reports. Select the Reports dataset you created earlier.Trees.Because you specified a Table name and selected the Write if empty preference, the query creates a table if the table does not already exist.
Accept the other default settings and click Save.
Click Run to run the query.
When the query completes, you are on the Results tab, where you can see the data.
Click Check my progress to verify the objective.
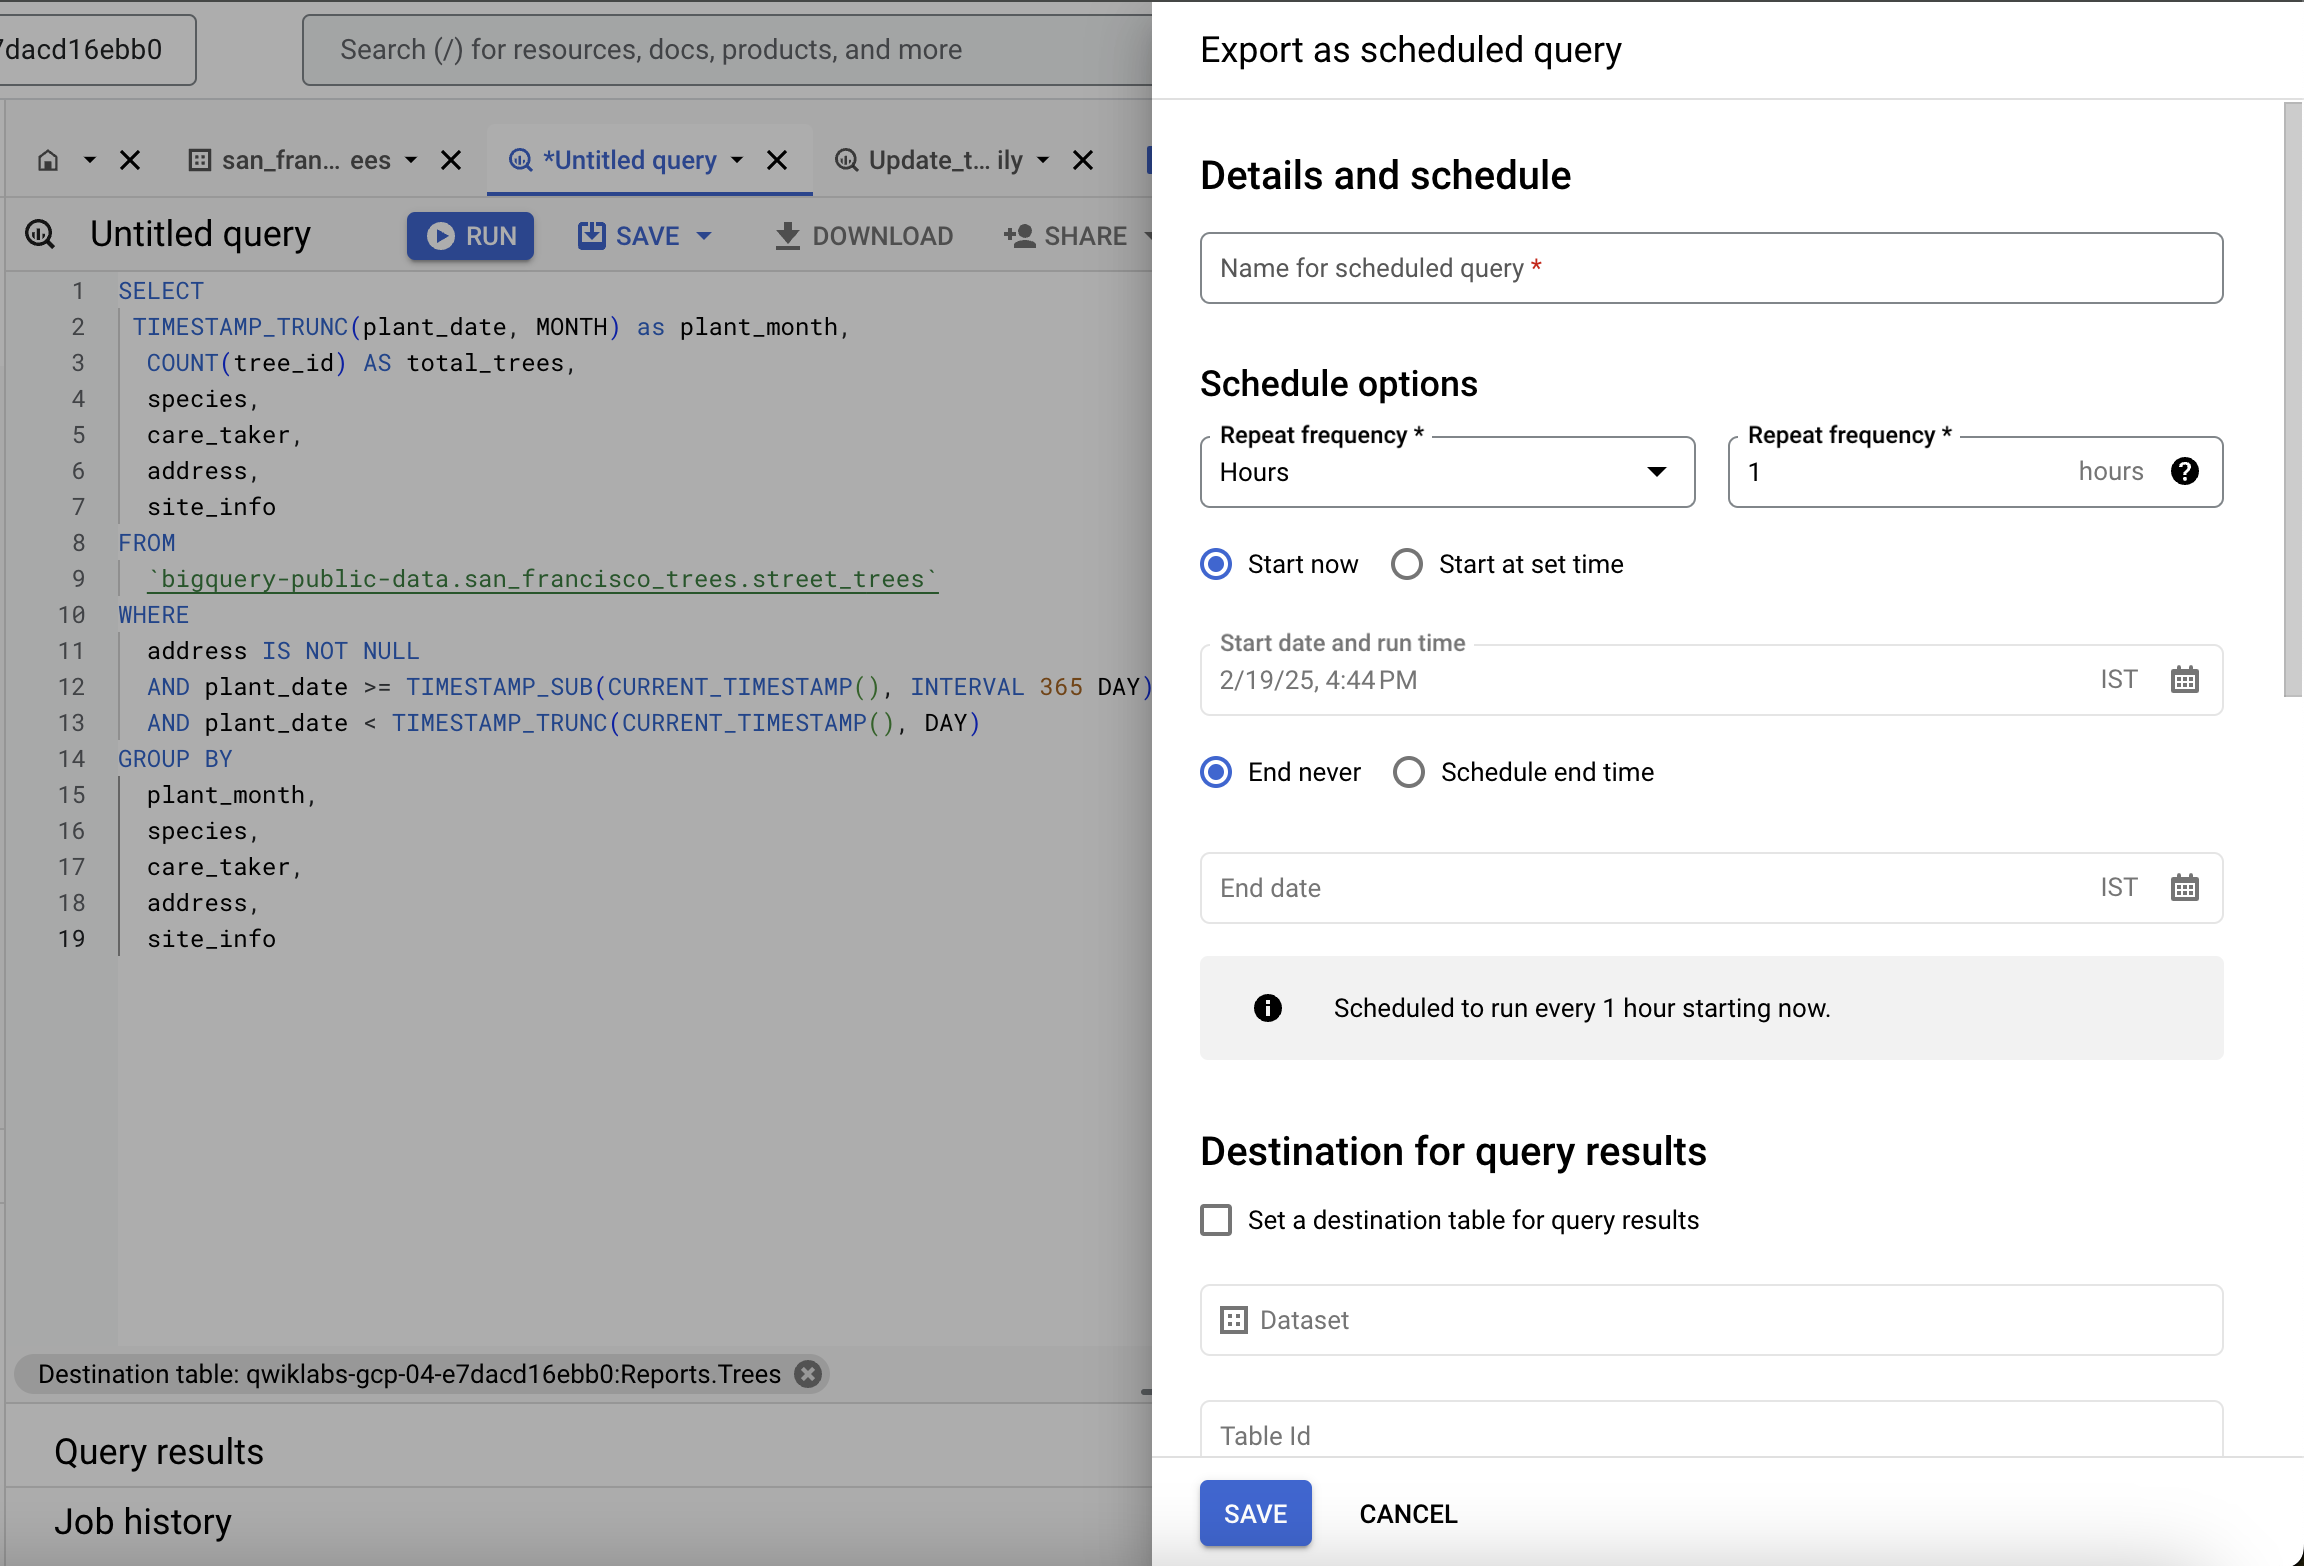
To keep your dashboard up-to-date, you can schedule queries to run on a recurring basis. Scheduled queries must be written in standard SQL, which can include Data Definition Language (DDL) and Data Manipulation Language (DML) statements. The query string and destination table can be parameterized, allowing you to organize query results by date and time.
Now you add a query that checks each day for new data. When new trees are planted, you'll get the additional stats updated directly into the reports.trees table.
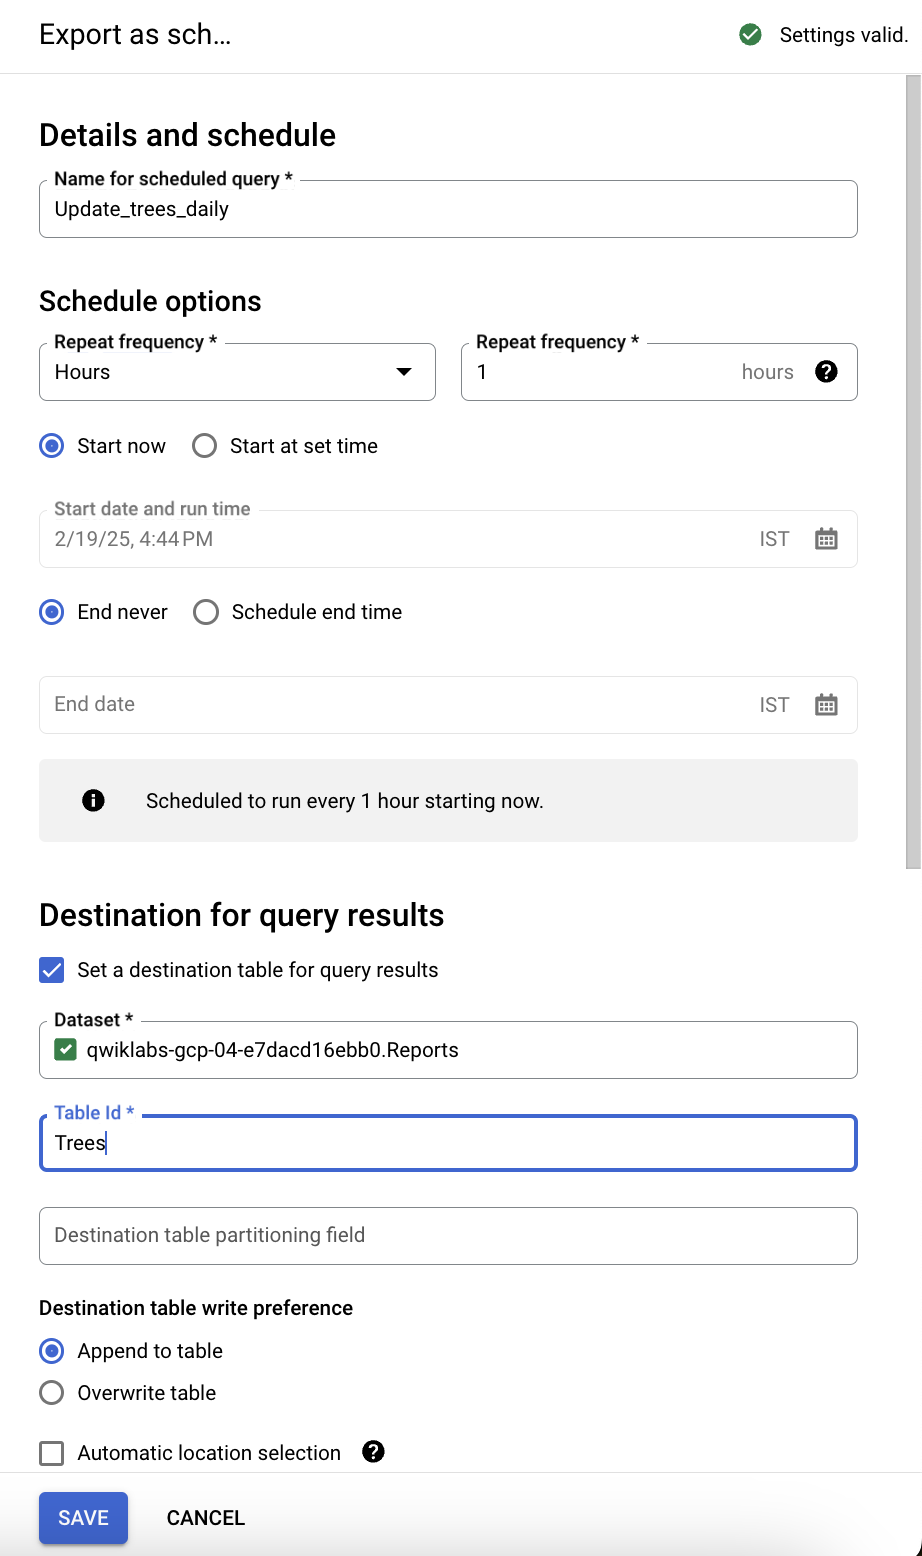
reports.trees table on a daily basis using the scheduled query feature:Name for scheduled query: Update_trees_daily
Schedule options:
Reports.Click Save.
You may have a popup blocker enabled, click Allow and then give your lab credentials permission, then agree to replace your query.
Now you'll build your dashboard using the tree data you've just aggregated with Looker Studio.
Open a new tab in your browser and go to Looker Studio.
Click Create in the top left, and then click Report.
Enter the country and check the terms and conditions.
Click Continue.
Select No for all email offers, and then click Continue.
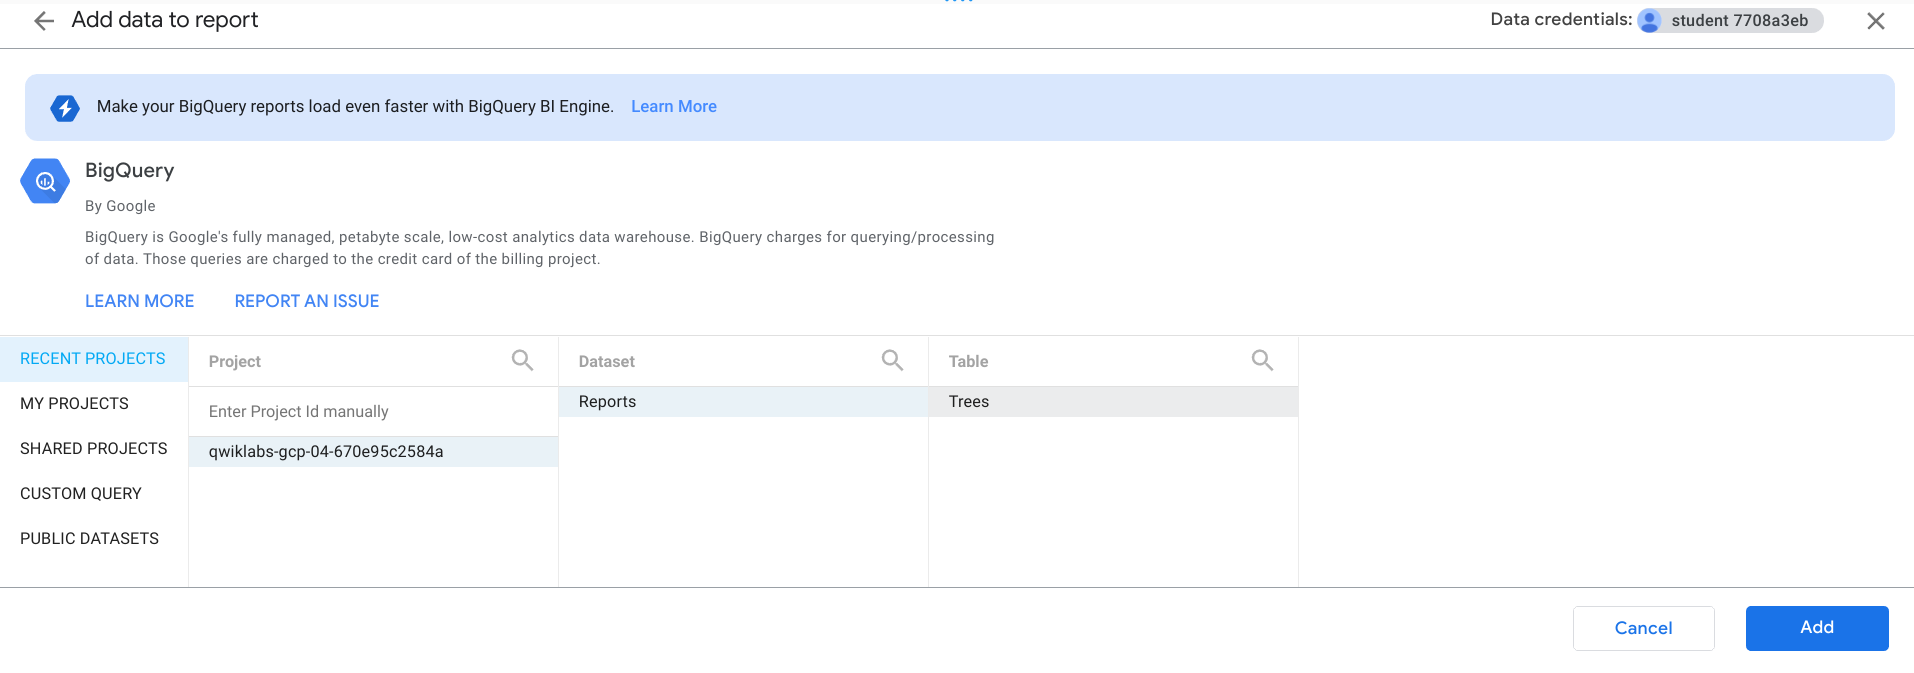
Now you'll use the BigQuery connector to connect to the reports.trees table.
Click Check my progress to verify the objective.
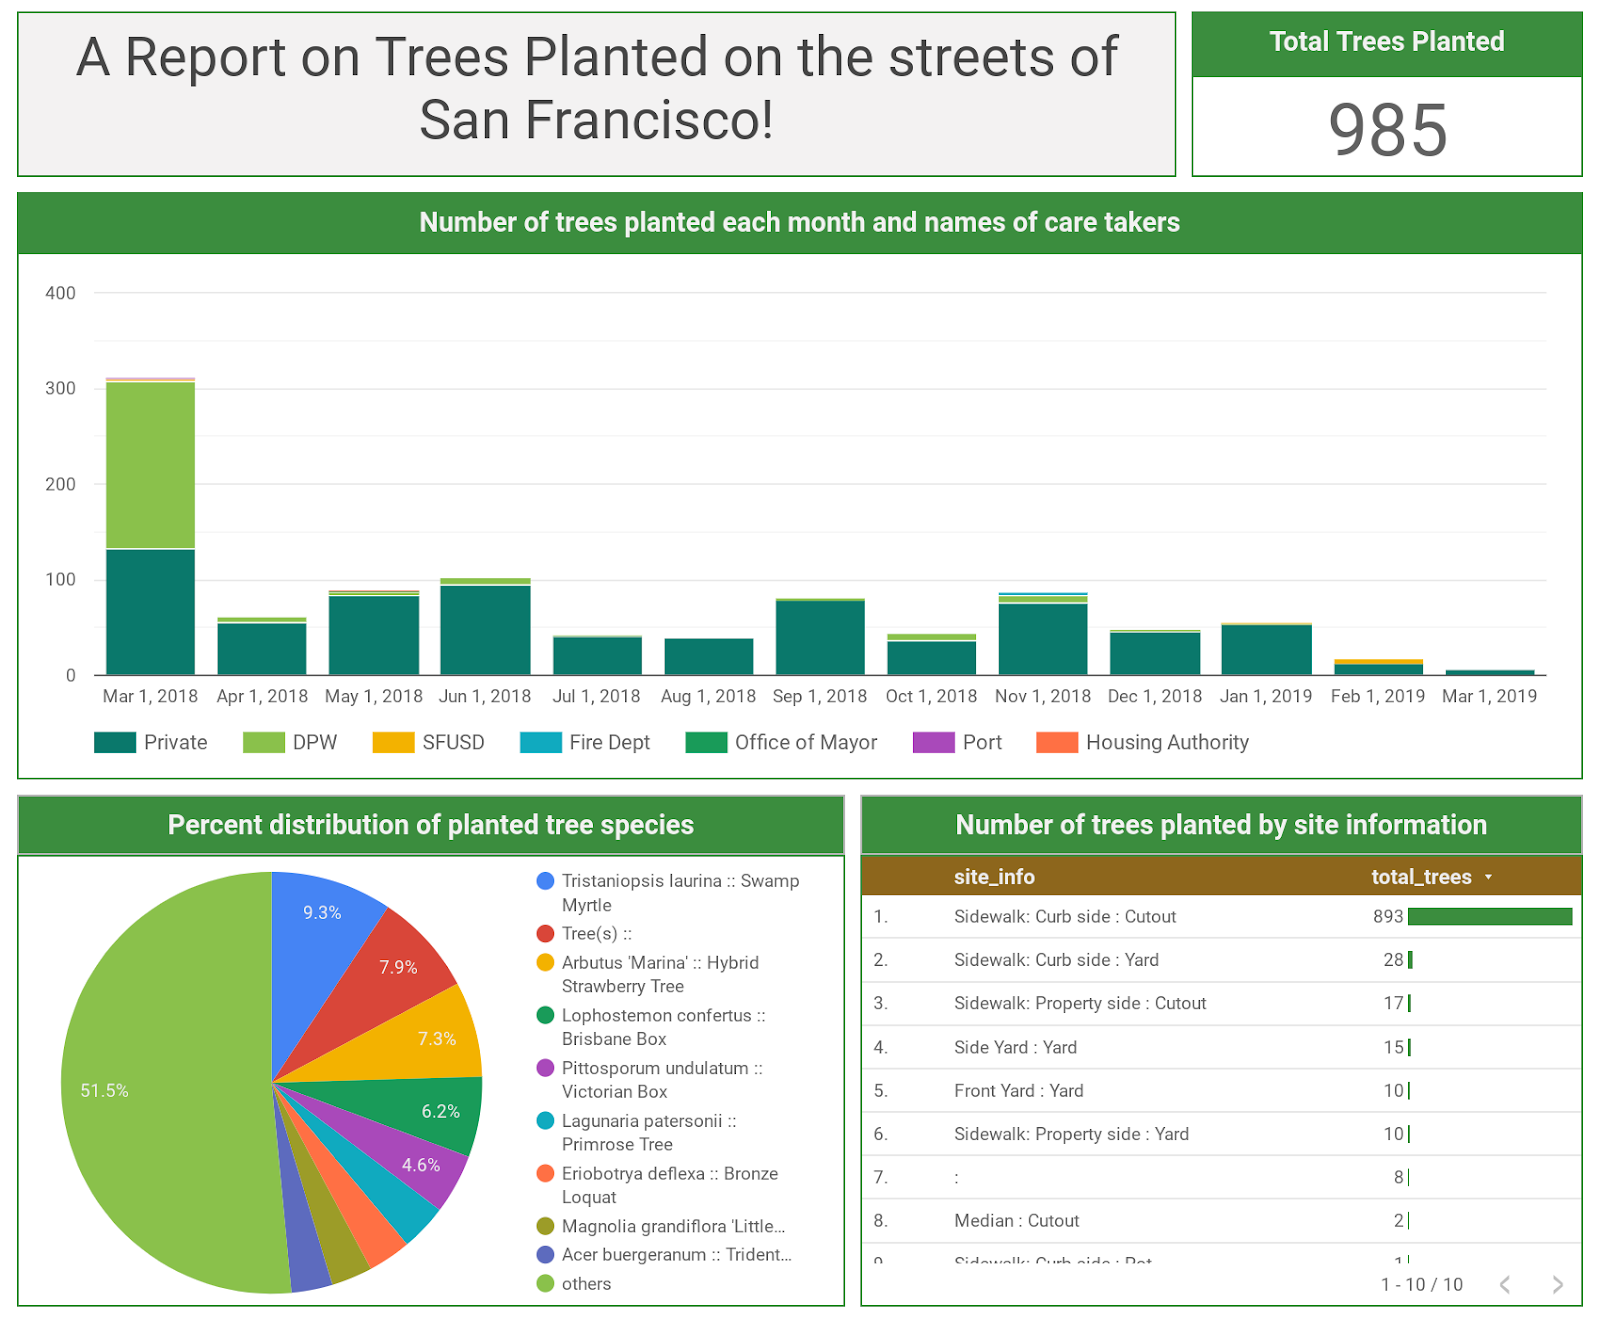
Now you can create charts using the data in this table.
Click on Add a chart dropdown and select the type you want. In this example, you can see the following types of charts:
You can experiment on your own creating charts and titles modeled after the example. Here are some hints:
Congratulations! In this lab, you learned how to build a BI dashboard for visualizing patterns in your business data with less risk of expensive query volumes. You created a dataset in BigQuery, ran a one-time query, scheduled a query, and created a report in Looker Studio. You can now use these skills to build your own BI dashboard with Looker Studio and BigQuery!
...helps you make the most of Google Cloud technologies. Our classes include technical skills and best practices to help you get up to speed quickly and continue your learning journey. We offer fundamental to advanced level training, with on-demand, live, and virtual options to suit your busy schedule. Certifications help you validate and prove your skill and expertise in Google Cloud technologies.
Manual Last Updated February 19, 2025
Lab Last Tested February 19, 2025
Copyright 2025 Google LLC All rights reserved. Google and the Google logo are trademarks of Google LLC. All other company and product names may be trademarks of the respective companies with which they are associated.


Diese Inhalte sind derzeit nicht verfügbar
Bei Verfügbarkeit des Labs benachrichtigen wir Sie per E-Mail

Sehr gut!
Bei Verfügbarkeit kontaktieren wir Sie per E-Mail

One lab at a time
Confirm to end all existing labs and start this one