

Before you begin
- Labs create a Google Cloud project and resources for a fixed time
- Labs have a time limit and no pause feature. If you end the lab, you'll have to restart from the beginning.
- On the top left of your screen, click Start lab to begin
Create a virtual machine to perform the creation of the pipeline and use as your website.
/ 20
Create the bigtable instance.
/ 20
Create a Google Cloud Storage bucket
/ 20
Run the dataflow pipeline
/ 20
Create a firewall rule to allow tcp:5000 for visualization.
/ 20
Today’s financial world is complex, and the old technology used for constructing financial data pipelines isn’t keeping up. With multiple financial exchanges operating around the world and global user demand, these data pipelines have to be fast, reliable and scalable.
Currently, using an econometric approach—applying models to financial data to forecast future trends—doesn’t work for real-time financial predictions. And data that’s old, inaccurate or from a single source doesn’t translate into dependable data for financial institutions to use.
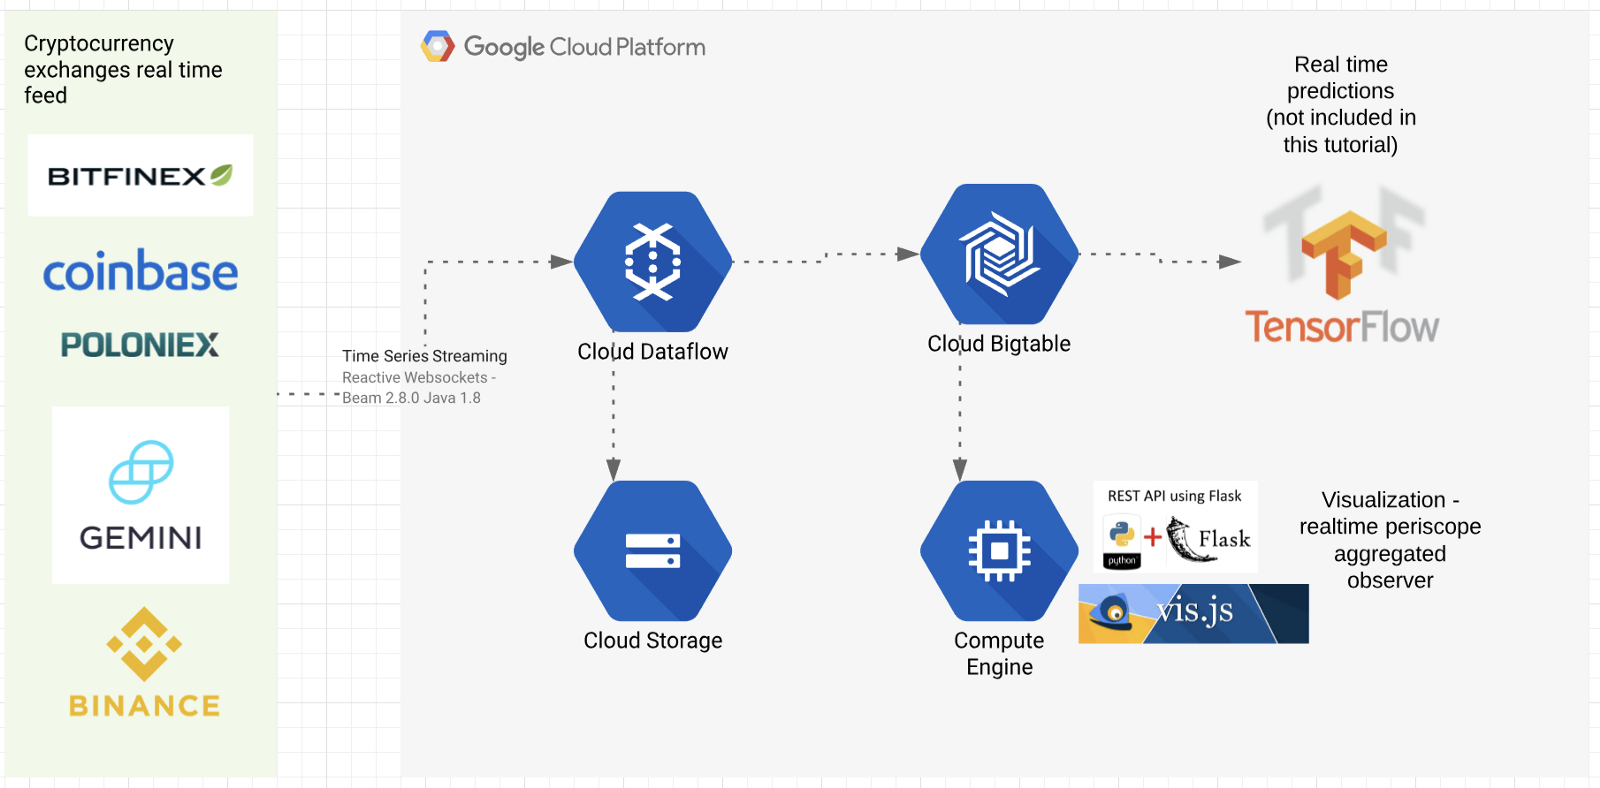
But building pipelines with Google Cloud can solve some of these key challenges. In this lab, you’ll describe how to build a pipeline to predict financial trends in microseconds, set up and configure a pipeline for ingesting real-time, time-series data from various financial exchanges, and how to design a suitable data model, which facilitates querying and graphing at scale.
You’ll find a tutorial below on setting up and deploying the proposed architecture using Google Cloud, particularly these products:
The tutorial will explain how to establish a connection to multiple exchanges, subscribe to their trade feed, and extract and transform these trades into a flexible format to be stored in Cloud Bigtable and be available to be graphed and analyzed.
This will also set the foundation for ML online learning predictions at scale. You’ll see how to graph the trades, volume, and time delta from trade execution until it reaches your system (an indicator of how close to real time you can get the data). You can find more details on GitHub too.
Architectural overview
The typical requirement for trading systems is low latency data ingestion, and for this lab is extended with near real-time data storage and querying at scale. You will learn the following from this lab:
The source code is written in Java 8, Python 3.7, JavaScript; and Maven, PIP for dependency/build management.
The code can be divided into five main framework units:
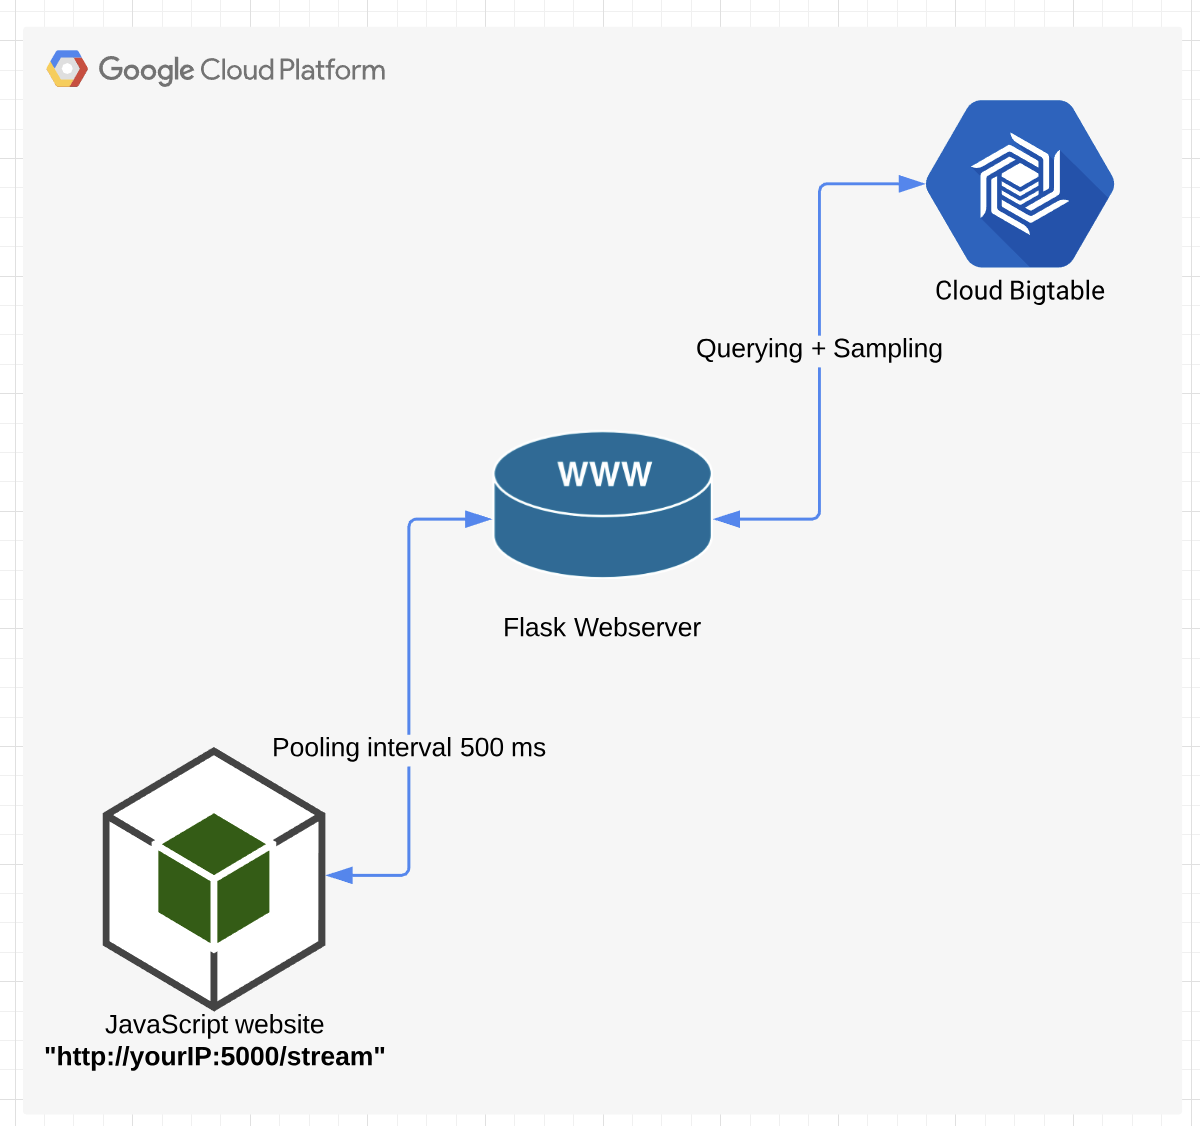
Flask web server will be run in the Google Cloud VM instance
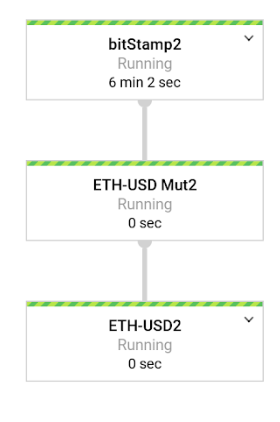
For every exchange + trading pair, a different pipeline instance is created. The pipeline consists of 3 steps:
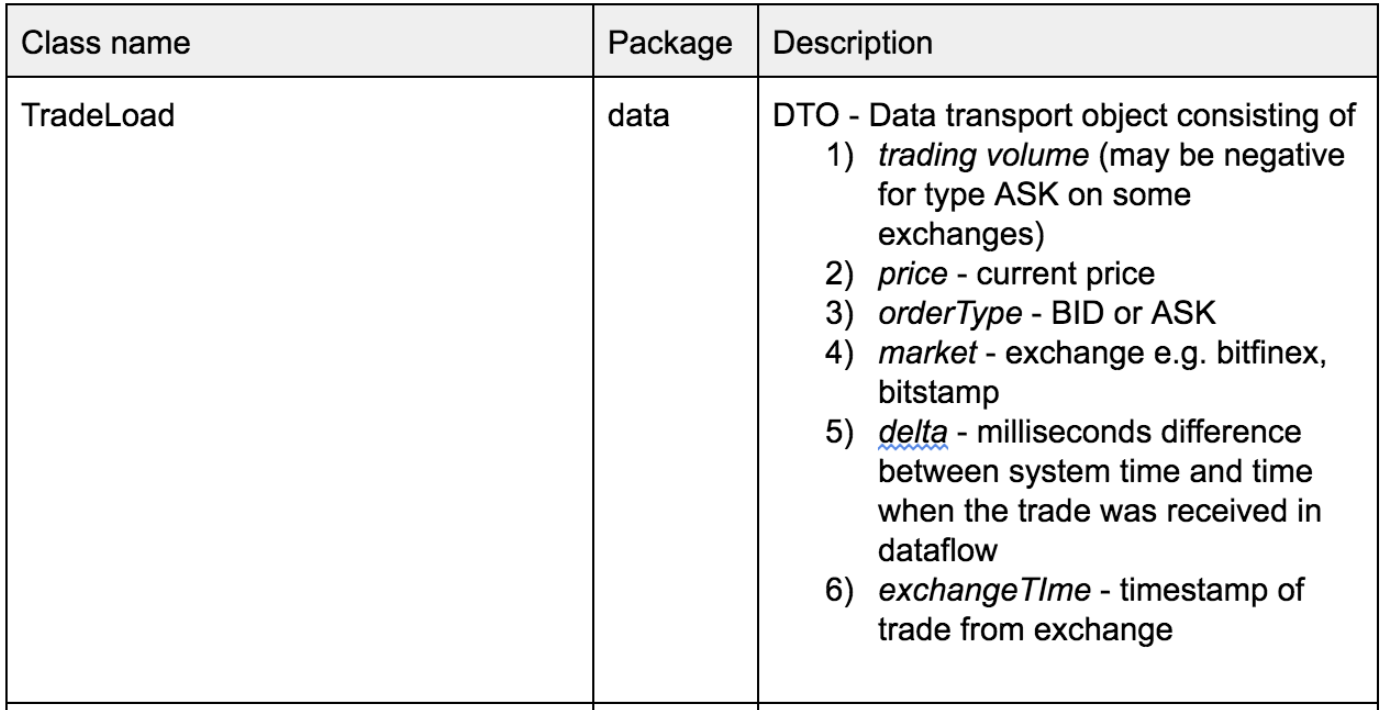
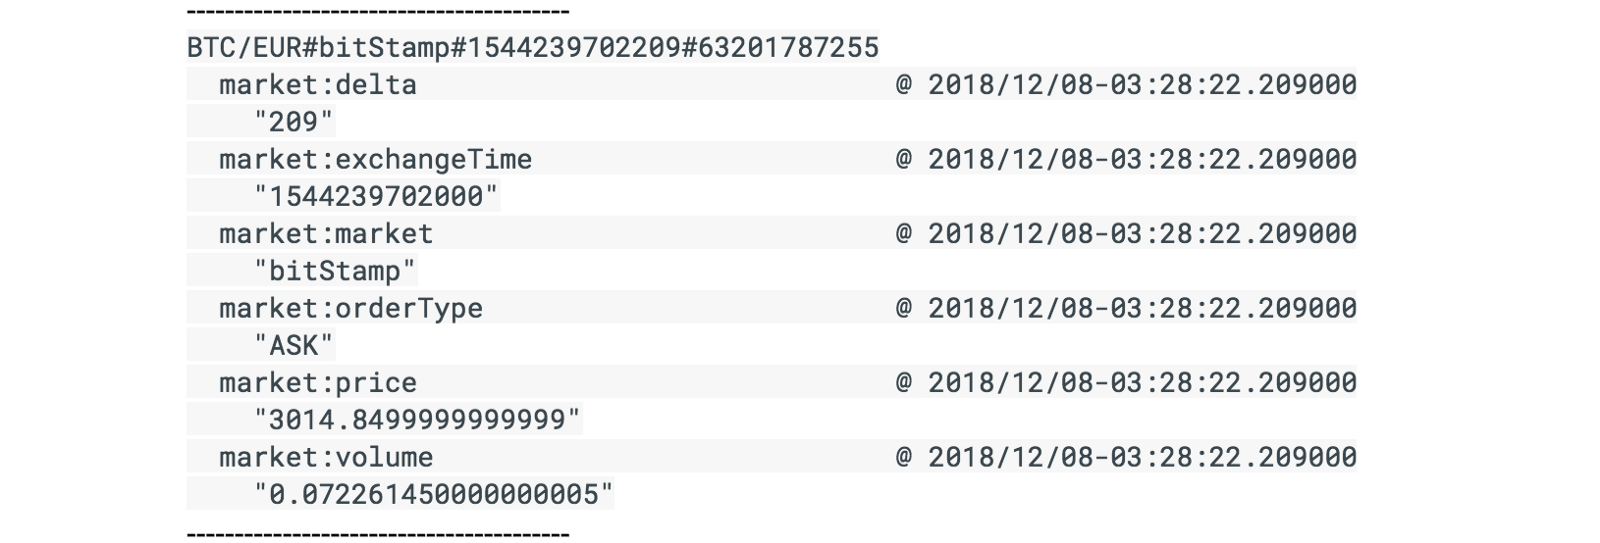
The DTO for this lab looks like this:
The row key structure is formulated in the following way:
TradingCurrency#Exchange#SystemTimestampEpoch#SystemNanosTime
E.g: a row key might look like BTC/USD#Bitfinex#1546547940918#63187358085
BTC/USD — Trading Pair
Bitfinex — Exchange
1546547940918 — Epoch timestamp ( more info)
63187358085 — System Nano time ( more info)
Nanotime is used to avoid multiple versions per row for different trades. Two DoFn mutations might execute in the same Epoch ms time if there is a streaming sequence of TradeLoad DTOs. NanoTime at the end will split Millisecond to an additional one million.
In your own environment, if this is not enough, you can hash the volume / price ratio and attach the hash at the end of the row key.
Row cells will contain an exact schema replica of the exchange TradeLoad DTO (see earlier in the table above). This choice will help you go from a specific (trading pair) — (exchange) to less specific (timestamp — nanotime) and avoid hotspots when you query the data.
Read these instructions. Labs are timed and you cannot pause them. The timer, which starts when you click Start Lab, shows how long Google Cloud resources are made available to you.
This hands-on lab lets you do the lab activities in a real cloud environment, not in a simulation or demo environment. It does so by giving you new, temporary credentials you use to sign in and access Google Cloud for the duration of the lab.
To complete this lab, you need:
Click the Start Lab button. If you need to pay for the lab, a dialog opens for you to select your payment method. On the left is the Lab Details pane with the following:
Click Open Google Cloud console (or right-click and select Open Link in Incognito Window if you are running the Chrome browser).
The lab spins up resources, and then opens another tab that shows the Sign in page.
Tip: Arrange the tabs in separate windows, side-by-side.
If necessary, copy the Username below and paste it into the Sign in dialog.
You can also find the Username in the Lab Details pane.
Click Next.
Copy the Password below and paste it into the Welcome dialog.
You can also find the Password in the Lab Details pane.
Click Next.
Click through the subsequent pages:
After a few moments, the Google Cloud console opens in this tab.

Cloud Shell is a virtual machine that is loaded with development tools. It offers a persistent 5GB home directory and runs on the Google Cloud. Cloud Shell provides command-line access to your Google Cloud resources.
Click Activate Cloud Shell 
Click through the following windows:
When you are connected, you are already authenticated, and the project is set to your Project_ID,
gcloud is the command-line tool for Google Cloud. It comes pre-installed on Cloud Shell and supports tab-completion.
Output:
Output:
gcloud, in Google Cloud, refer to the gcloud CLI overview guide.
You need a virtual machine to perform the creation of the pipeline and use as your website.
The compute engine service account is used with the cloud API scope. This provides the necessary permissions to create the necessary resources for your environment.
Wait for the instance to start.
Click Check my progress to verify the objective.
In the Cloud Platform Console, on the Navigation menu, click Compute Engine > VM Instances.
For the instance called crypto-driver , click SSH.
A window will open and you will be automatically logged into the instance. You will run all commands for the remainder of this lab in the SSH window.
This will also install virtualenv for the Python environment. All the Python related code will be executed in the Virtualenv.
Click Check my progress to verify the objective.
For this lab, one column family called market is used to simplify the schema design. For more on that you can read this link.
This bucket will be used by the Dataflow job as a staging area for the Jar files.
Click Check my progress to verify the objective.
Output:
The code for this lab is written in Java, which needs to be compiled and packaged as a Jar file using Maven build tool. The build will take a couple of minutes, please wait until you see the BUILD SUCCESS message.
If you check the logs, don't worry about the errors you see. It is safe to ignore illegal thread pool exceptions.
Wait for the command to complete.
run.sh script is a wrapper to submit the crypto tracking Dataflow job on Google Cloud. It takes the following arguments:
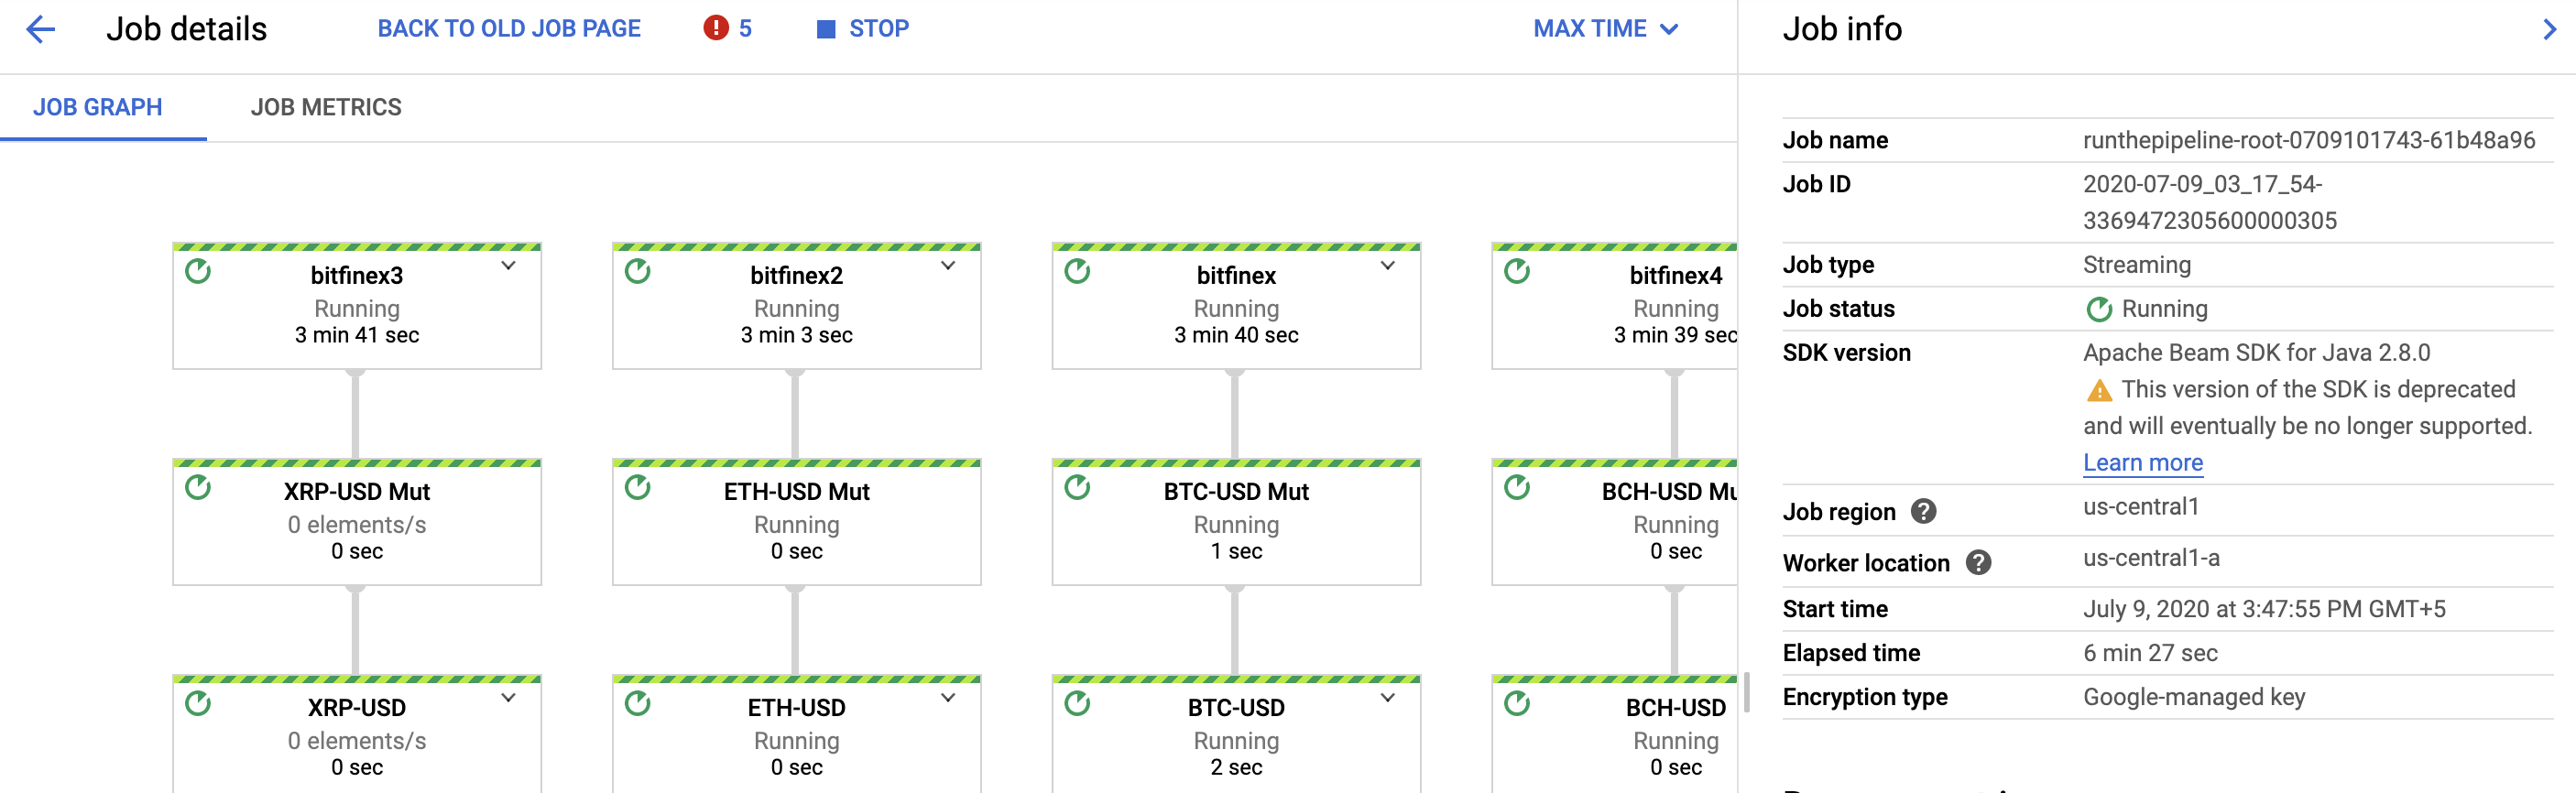
When the pipeline starts, it will create two worker nodes. At this point, you will see two additional VMs in your project.
You will see something like the following if the data is flowing. If you see nothing, please wait for a minute and try again.
Click Check my progress to verify the objective.
In the Cloud Platform Console, on the Navigation menu, click Dataflow.
Click the name of the existing pipeline.
You should see the status as Running for the listed jobs.
You will configure the environment and run the python Flask frontend server visualization in these next steps.
Click Check my progress to verify the objective.
frontend directory:If prompted Proceed (Y/n)?, press Y.
app.py is a Python application to visualize the Crypto currency data stored in the Bigtable table “cryptorealtime”.
crypto-driver instance:Copy the EXTERNAL IP address displayed to use for the next command.
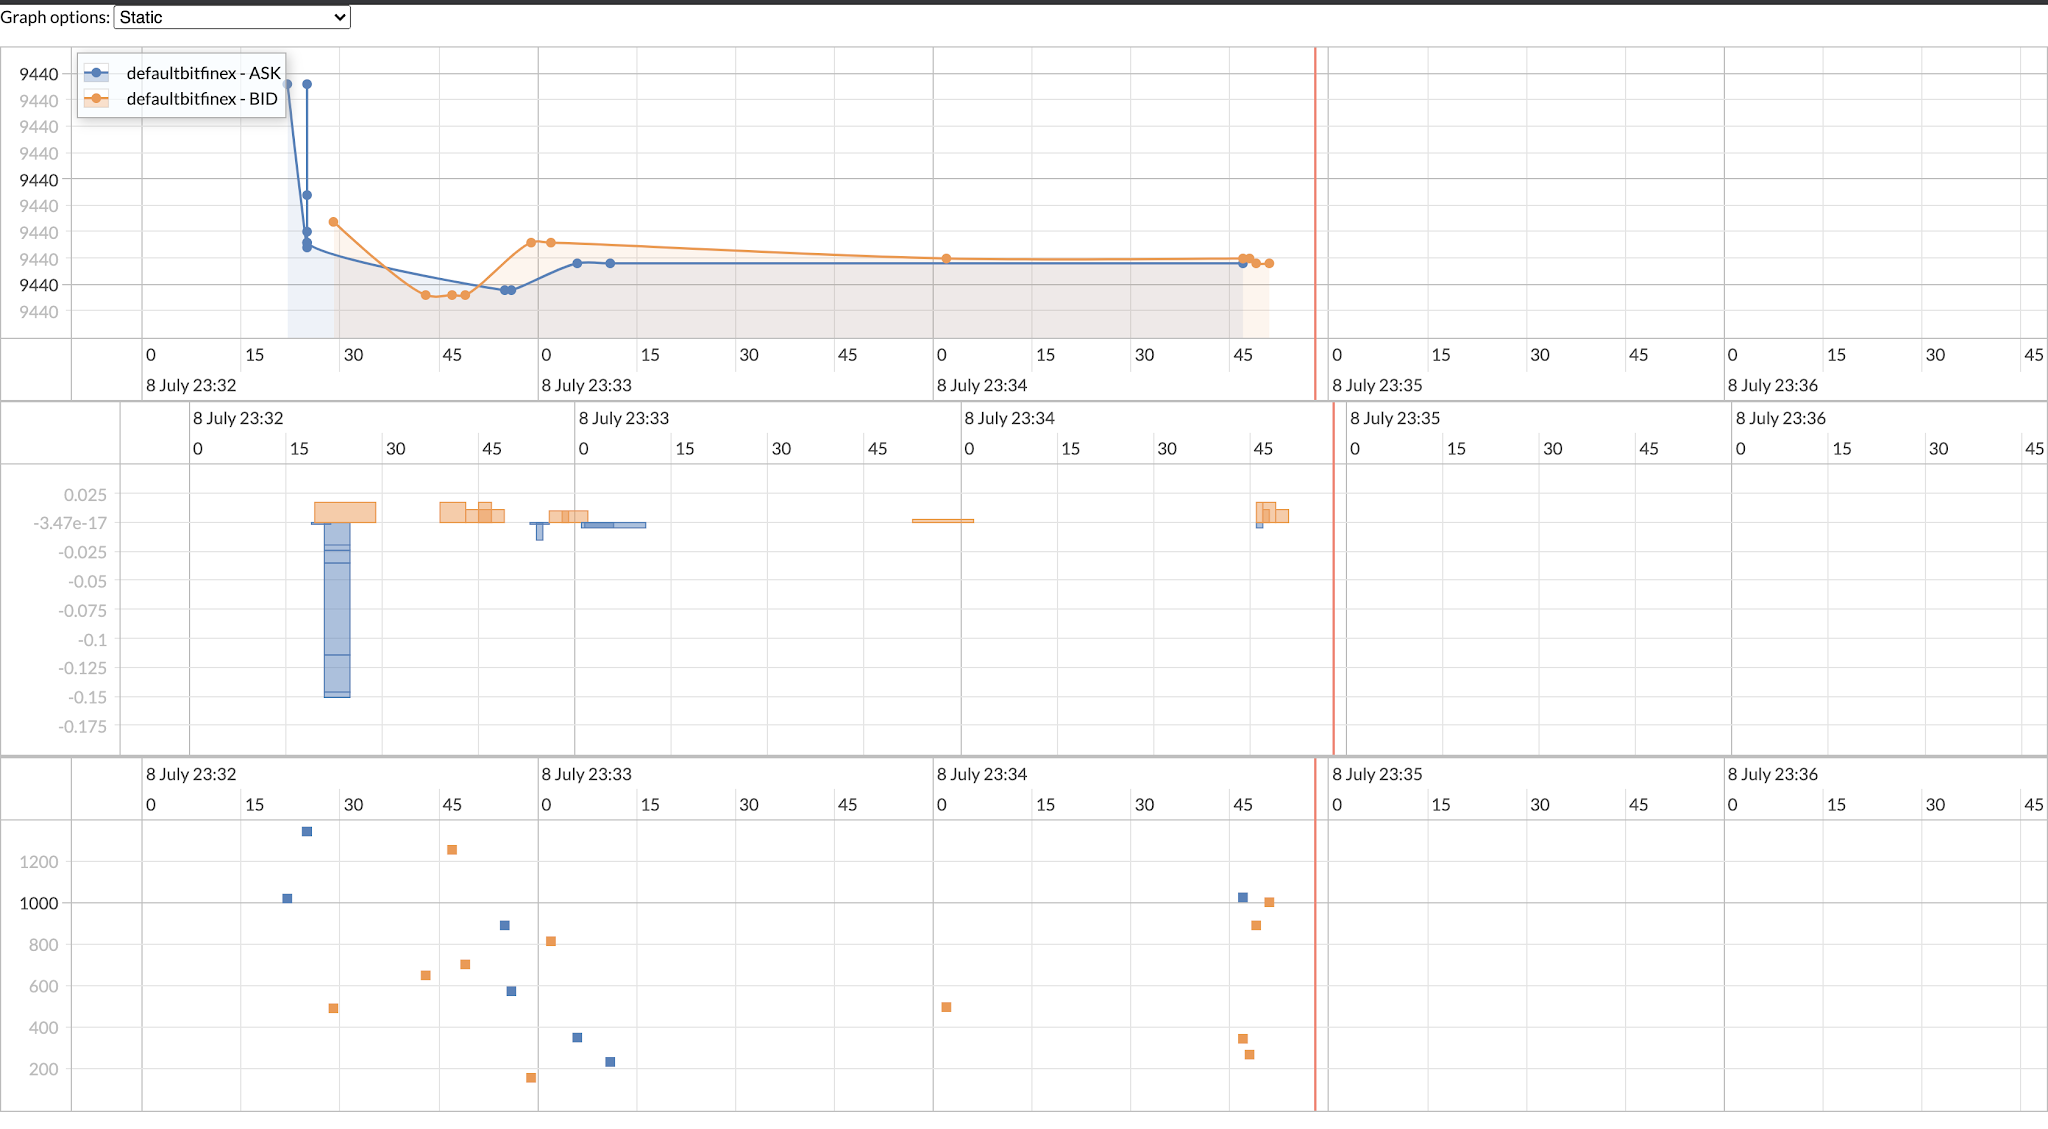
Open a new tab in your web browser and use the following URL to see the visualization, replacing <external-ip> with the IP address returned from the previous command:
You should see the visualization of aggregated ASK/BID pair on several exchanges (without predictor part).
You have created a real-time "periscope" multi-exchange observer.
When you end this lab, the lab platform deletes the resources you used. In your own environment, it is useful to know how to save costs by cleaning up your unused, or no longer required, resources.
Console: Return to Dataflow page, click on the name of your job and click Stop. Select Cancel, then Stop Job.
Inside the second SSH session run:
When the pipeline stops, return to the command line in the SSH session by pressing CTRL+C.
If prompted, Do you want to continue (Y/n), press Y.
Close the SSH console.
In the Cloud Platform Console, on the Navigation menu, click Compute Engine > VM Instances.
Check the box next to the crypto-driver instance then click Delete, then Delete again to confirm your action.
You have learned how to do the following:
Set up and configure a pipeline for ingesting real-time time-series data from various crypto exchanges.
Design a suitable data model, which facilitates querying and graphing at scale.
Set up and deploy the proposed architecture using Google Cloud.
You established a connection to multiple exchanges, subscribed to their trade feed, then extracted and transformed these trades into a flexible format to be stored in Bigtable to be graphed and analyzed.
This lab is based on this Medium article by Ivo Galic.
...helps you make the most of Google Cloud technologies. Our classes include technical skills and best practices to help you get up to speed quickly and continue your learning journey. We offer fundamental to advanced level training, with on-demand, live, and virtual options to suit your busy schedule. Certifications help you validate and prove your skill and expertise in Google Cloud technologies.
Manual Last Tested January 22, 2024
Manual Last Updated January 22, 2024
Copyright 2025 Google LLC All rights reserved. Google and the Google logo are trademarks of Google LLC. All other company and product names may be trademarks of the respective companies with which they are associated.


Ta treść jest obecnie niedostępna
Kiedy dostępność się zmieni, wyślemy Ci e-maila z powiadomieniem

Świetnie
Kiedy dostępność się zmieni, skontaktujemy się z Tobą e-mailem

One lab at a time
Confirm to end all existing labs and start this one