Checkpoints
Create the AI platform notebook instance
/ 25
Clone course repo within AI platform notebooks instance
/ 25
Explore and visualize data
/ 50
Understand, Explore, and Visualize a Time Series Dataset
GSP733

Overview
Time series forecasting can be framed as a supervised learning problem in which series of data points are indexed in time order. Most commonly, a time series is a sequence taken at successive equally spaced points in time. Analyzing such points allows for a machine learning model to identify patterns present on continuum data.
Objectives
In this lab, you will:
- Import datasets from FRED®
- Transform data so that it can be used in a machine learning model
- Load, explore, and visualize time-series data
Setup and Requirements
Before you click the Start Lab button
Read these instructions. Labs are timed and you cannot pause them. The timer, which starts when you click Start Lab, shows how long Google Cloud resources will be made available to you.
This hands-on lab lets you do the lab activities yourself in a real cloud environment, not in a simulation or demo environment. It does so by giving you new, temporary credentials that you use to sign in and access Google Cloud for the duration of the lab.
To complete this lab, you need:
- Access to a standard internet browser (Chrome browser recommended).
- Time to complete the lab---remember, once you start, you cannot pause a lab.
How to start your lab and sign in to the Google Cloud console
-
Click the Start Lab button. If you need to pay for the lab, a pop-up opens for you to select your payment method. On the left is the Lab Details panel with the following:
- The Open Google Cloud console button
- Time remaining
- The temporary credentials that you must use for this lab
- Other information, if needed, to step through this lab
-
Click Open Google Cloud console (or right-click and select Open Link in Incognito Window if you are running the Chrome browser).
The lab spins up resources, and then opens another tab that shows the Sign in page.
Tip: Arrange the tabs in separate windows, side-by-side.
Note: If you see the Choose an account dialog, click Use Another Account. -
If necessary, copy the Username below and paste it into the Sign in dialog.
{{{user_0.username | "Username"}}} You can also find the Username in the Lab Details panel.
-
Click Next.
-
Copy the Password below and paste it into the Welcome dialog.
{{{user_0.password | "Password"}}} You can also find the Password in the Lab Details panel.
-
Click Next.
Important: You must use the credentials the lab provides you. Do not use your Google Cloud account credentials. Note: Using your own Google Cloud account for this lab may incur extra charges. -
Click through the subsequent pages:
- Accept the terms and conditions.
- Do not add recovery options or two-factor authentication (because this is a temporary account).
- Do not sign up for free trials.
After a few moments, the Google Cloud console opens in this tab.

Prerequisites
The prerequisites for this quest are:
- Experience with development of ML models
- Experience with deep learning architectures for ML model development such as: RNNs and LSTMs
- Experience with Python
Lab scenario
You have been hired to work on a project for the U.S. Bureau of Economic Analysis. Your task, should you choose to accept it, will be to use machine learning to predict total vehicle sales in the USA, based on previous sales and the unemployment rate.
Before diving into the ins-and-outs of exploring datasets and creating models, review the main concepts related to time series, which seems to be the problem that is being portrayed in this scenario.
Task 1. Introduction to Time Series Forecasting
The focus of this quest is on how to apply time series forecasting techniques using the Google Cloud. It isn't a general time series forecasting course, but instead a brief tour of the concepts which may be helpful for you.
Time Series Data
First, what is a time series? It's a dataset with data recorded at regular time intervals. A time series dataset contains both time and at least one variable that is dependent on time.
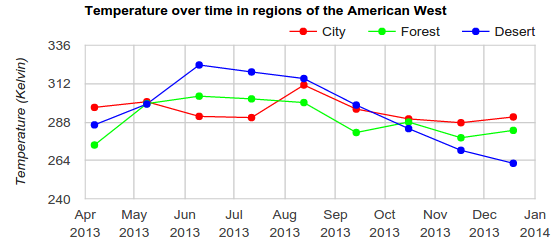
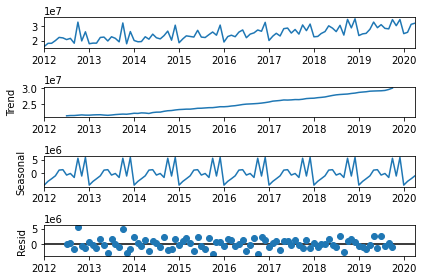
Components
A time series can be decomposed into components:
- Trend: moves up or down in a reasonably predictable pattern.
- Seasonal: repeats over a specific period such as a day, week, month, season, etc.
- Random: has residual fluctuations. Residual is the difference between a predicted value and the observed value in a given point in time.
There can be multiple layers of seasonality. For example, a call center might see a pattern in call volume on certain days of the week as well as on given months. The residual might be able to be explained by other variables besides time.
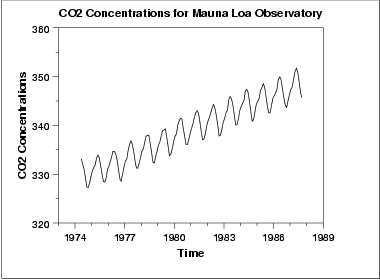
Stationarity
For best results in forecasting, time series data should be made stationary, where statistical properties such as mean and variance are constant over time. Techniques such as differencing and detrending can be applied to raw data to make it more stationary.
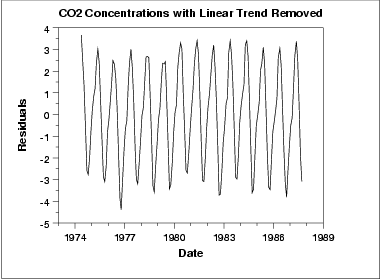
For example, the plot below of CO2 concentration shows a repeating yearly pattern with an upward trend. (Source)
After removing the linear trend, the data is more suitable for forecasting, as it now has a constant mean.
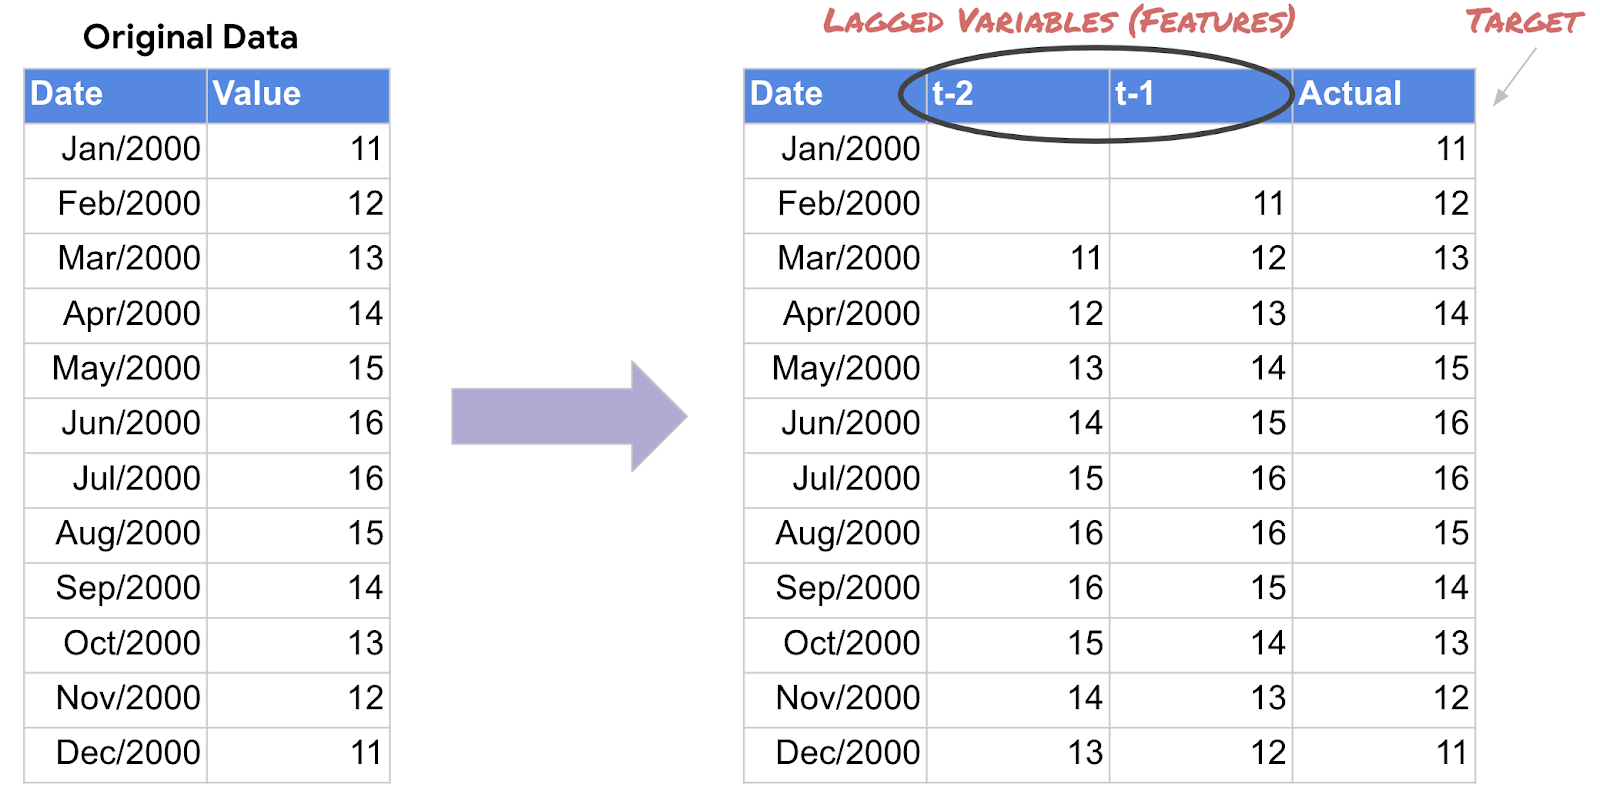
Using ime Series Data for Machine Learning
To use time series data in a machine learning problem, the data needs to be transformed so that previous values can be used to predict future values. This table shows an example of how lagged variables are created to help predict the target.
Now that you've covered some fundamentals, you can get started exploring data and forecasting!
Task 2. Launch an Vertex AI Notebook
To create and launch a Vertex AI Workbench notebook:
-
In the Navigation Menu
, click Vertex AI > Workbench.
-
On the Workbench page, click Enable Notebooks API (if it isn't enabled yet).
-
Click on User-Managed Notebooks tab then, click Create New.
-
Name the notebook.
-
Set Region to
and Zone to . -
In the New instance menu, choose the latest version of TensorFlow Enterprise 2.11 in Environment.
-
Click Advanced Options to edit the instance properties.
-
Click Machine type and then select e2-standard-2 for Machine type.
-
Leave the remaining fields at their default and click Create.
After a few minutes, the Workbench page lists your instance, followed by Open JupyterLab.
- Click Open JupyterLab to open JupyterLab in a new tab. If you get a message saying beatrix jupyterlab needs to be included in the build, just ignore it.
Click Check my progress to verify the objective.
Task 3. Clone the Sample Code
To clone the training-data-analyst repository in your JupyterLab instance:
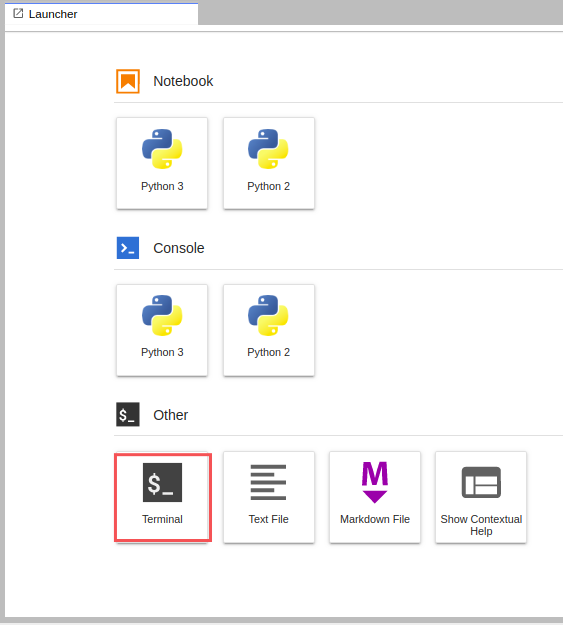
- In JupyterLab, click the Terminal icon to open a new terminal.
- At the command-line prompt, type the following command and press ENTER:
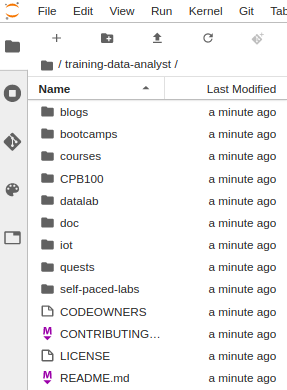
- To confirm that you have cloned the repository, in the left panel, double click the
training-data-analystfolder to see its contents.
Click Check my progress to verify the objective.
Task 4. Explore and Visualize Data
In this section, you will create a query that groups data into a time series, fill in missing values, visualize data, and decompose time series into trend and seasonal components.
-
In Vertex AI Notebooks, navigate to
training-data-analyst/courses/ai-for-time-series/notebooksand open01-explore.ipynb. -
Clear all the cells in the notebook (look for the Clear button on the notebook toolbar), change the region with
, project with and bucket settings in the first cell, and then Run the cells one by one.
Click Check my progress to verify the objective.
Congratulations!
In this lab, you first launched an Vertex AI notebook and downloaded the sample files. You then created a query that groups data into a time series and visualized the data. Lastly, you decomposed time series into trend and seasonal components, and exported your data as a CSV file.
Google Cloud training and certification
...helps you make the most of Google Cloud technologies. Our classes include technical skills and best practices to help you get up to speed quickly and continue your learning journey. We offer fundamental to advanced level training, with on-demand, live, and virtual options to suit your busy schedule. Certifications help you validate and prove your skill and expertise in Google Cloud technologies.
Manual Last Updated November 22, 2023
Lab Last Tested November 22, 2023
Copyright 2024 Google LLC All rights reserved. Google and the Google logo are trademarks of Google LLC. All other company and product names may be trademarks of the respective companies with which they are associated.

